Lead Service Lines by State: EPA Projections for All 53 Jurisdictions With Lead or Galvanized Pipe

The short answer
EPA projects 3,956,383 lead and galvanized service lines across US states and territories. Illinois holds the most at 631,642 and the highest density at 16.48 percent of its connections. Just under a third of the national figure, 1,296,400 lines, is galvanized pipe rather than lead. Distinguishing galvanized from lead often comes down to a simple at-home check, covered in our guide on how to identify lead pipes.
What this page is. The state-level breakdown behind EPA’s national projection of roughly 4 million lead service lines, taken from the agency’s own published projections spreadsheet. It reports something the national headline figure hides: 32.8 percent of that number is galvanized pipe requiring replacement, not lead pipe, and the proportion varies enormously by state. In Texas, only 4.2 percent of the projected figure is lead. In Illinois it is 88.9 percent. Curious how your state’s lead pipe tally lines up with its broader compliance record? See drinking water violation rates by state for that picture.
What the table shows
- EPA projects 3,956,383 lead and galvanized-requiring-replacement service lines across US states and territories, the figure usually rounded to 4 million.
- Of that total, 2,659,983 are projected lead service lines and 1,296,400 are galvanized pipe requiring replacement. Galvanized pipe is 32.8 percent of the headline number.
- Illinois has the most of any state at 631,642, followed by Ohio at 406,565 and New York at 383,390.
- Illinois also has the highest density of any state at 16.48 percent, meaning roughly one service line in six is lead or galvanized requiring replacement.
- Nationally the density is 3.84 percent of 102,958,322 total projected service lines.
- In several states the projection is overwhelmingly galvanized rather than lead. Georgia is 0.4 percent lead, Texas 4.2 percent, Alabama 7.6 percent and Florida 10.8 percent.
- Meeting the 31 December 2037 deadline requires Illinois alone to replace roughly 63,164 lines a year for ten years.
- Federal funding for this work is at an inflection point. The Infrastructure Investment and Jobs Act appropriation expires on 30 September 2026.
Sourced figures
- Total projected lead and galvanized requiring replacement: 3,956,383. Source: US EPA, 2025 Updated Service Line Projections, 7th DWINSA.
- Projected lead service lines: 2,659,983, or 67.2 percent of the total. Source: US EPA, 2025 Updated Service Line Projections.
- Projected galvanized requiring replacement: 1,296,400, or 32.8 percent. Source: US EPA, 2025 Updated Service Line Projections.
- Total projected service lines of all materials: 102,958,322. Source: US EPA, 2025 Updated Service Line Projections.
- National density of lead and galvanized lines: 3.84 percent. Source: calculated from EPA projections.
- Highest state count: Illinois, 631,642. Source: US EPA, 2025 Updated Service Line Projections.
- Highest state density: Illinois, 16.48 percent. Source: calculated from EPA projections.
- Lowest lead share among states above 20,000 lines: Georgia, 0.4 percent, with 225 lead lines against 53,632 galvanized. Source: US EPA, 2025 Updated Service Line Projections.
- Texas lead share: 4.2 percent, with 6,116 lead lines against 137,872 galvanized. Source: US EPA, 2025 Updated Service Line Projections.
- Replacement deadline: 31 December 2037, under the Lead and Copper Rule Improvements.
- Compliance date when the transition begins: 1 November 2027. Source: US EPA, Lead and Copper Rule Improvements.
- Minimum replacement pace: an average of 10 percent per year on a three-year rolling average. Source: US EPA, Lead and Copper Rule Improvements.
- Underlying inventories were required under the Lead and Copper Rule Revisions, initial inventory due 16 October 2024. Source: US EPA.
- IIJA dedicated appropriation for lead service line replacement: 15 billion dollars. Source: US EPA, 2025 Update to the 7th DWINSA.
- That appropriation expires 30 September 2026. Source: EPA and state revolving fund programme reporting.
Why a third of the number is not lead pipe
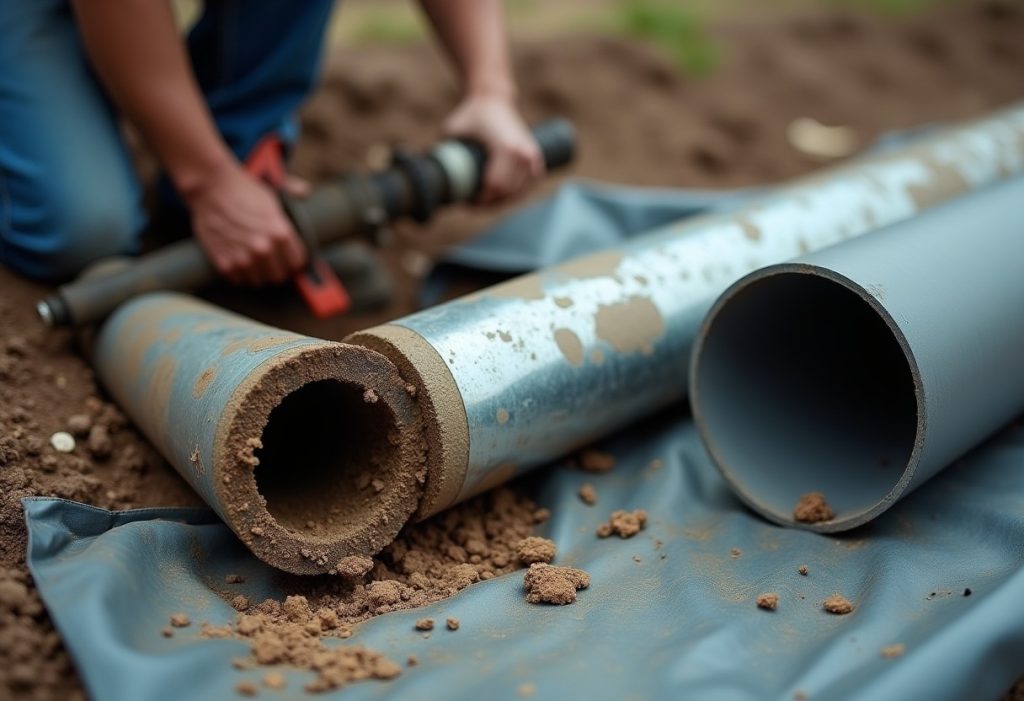
EPA counts galvanized pipe requiring replacement inside its lead service line projections. The agency’s stated reason is that lead can adhere to galvanized steel, so a galvanized line downstream of a lead component is treated as requiring replacement. That is a defensible regulatory definition, and it is also why the headline figure is not a count of lead pipe.
The distinction matters because the two materials are distributed very differently. States with old industrial housing stock in the Great Lakes region hold mostly actual lead. States across the South hold mostly galvanized.
| State | Lead share of projection | Lead lines | Galvanized lines |
|---|---|---|---|
| Wisconsin | 92.9 percent | 179,636 | 13,753 |
| Illinois | 88.9 percent | 561,532 | 70,110 |
| Indiana | 88.0 percent | 230,380 | 31,517 |
| Kansas | 22.1 percent | 21,490 | 75,931 |
| Florida | 10.8 percent | 5,605 | 46,102 |
| Alabama | 7.6 percent | 5,138 | 62,825 |
| Texas | 4.2 percent | 6,116 | 137,872 |
| Georgia | 0.4 percent | 225 | 53,632 |
Source: US EPA, 2025 Updated Service Line Projections, 7th DWINSA.
Every jurisdiction with lead or galvanized pipe
Fifty-three of the 56 states and territories in EPA’s table have at least one projected lead or galvanized line. Density is the share of that jurisdiction’s total projected service lines. The final column is the flat annual pace required to clear the projection across the ten years from the November 2027 compliance date to the December 2037 deadline.
| Rank | State or territory | Lead + galvanized | Lead | Galvanized | Lead share | Total service lines | Density | Per year to 2037 |
|---|---|---|---|---|---|---|---|---|
| 1 | Illinois | 631,642 | 561,532 | 70,110 | 88.9% | 3,832,962 | 16.48% | 63,164 |
| 2 | Ohio | 406,565 | 337,371 | 69,194 | 83.0% | 3,670,033 | 11.08% | 40,656 |
| 3 | New York | 383,390 | 333,779 | 49,611 | 87.1% | 3,813,107 | 10.05% | 38,339 |
| 4 | Michigan | 294,388 | 230,346 | 64,042 | 78.2% | 2,641,715 | 11.14% | 29,439 |
| 5 | Pennsylvania | 264,961 | 167,306 | 97,655 | 63.1% | 3,947,685 | 6.71% | 26,496 |
| 6 | Indiana | 261,897 | 230,380 | 31,517 | 88.0% | 2,095,194 | 12.50% | 26,190 |
| 7 | New Jersey | 206,711 | 103,092 | 103,619 | 49.9% | 2,533,005 | 8.16% | 20,671 |
| 8 | Wisconsin | 193,389 | 179,636 | 13,753 | 92.9% | 1,436,064 | 13.47% | 19,339 |
| 9 | Texas | 143,988 | 6,116 | 137,872 | 4.2% | 9,583,597 | 1.50% | 14,399 |
| 10 | Missouri | 117,273 | 53,871 | 63,402 | 45.9% | 2,196,745 | 5.34% | 11,727 |
| 11 | Minnesota | 108,200 | 86,742 | 21,458 | 80.2% | 1,499,349 | 7.22% | 10,820 |
| 12 | Kansas | 97,421 | 21,490 | 75,931 | 22.1% | 941,433 | 10.35% | 9,742 |
| 13 | Iowa | 95,724 | 74,143 | 21,581 | 77.5% | 1,433,000 | 6.68% | 9,572 |
| 14 | Tennessee | 81,796 | 29,357 | 52,439 | 35.9% | 2,879,010 | 2.84% | 8,180 |
| 15 | Alabama | 67,963 | 5,138 | 62,825 | 7.6% | 2,324,308 | 2.92% | 6,796 |
| 16 | Nebraska | 55,754 | 23,971 | 31,783 | 43.0% | 654,523 | 8.52% | 5,575 |
| 17 | Georgia | 53,857 | 225 | 53,632 | 0.4% | 3,278,906 | 1.64% | 5,386 |
| 18 | Florida | 51,707 | 5,605 | 46,102 | 10.8% | 7,412,622 | 0.70% | 5,171 |
| 19 | Massachusetts | 51,506 | 35,359 | 16,147 | 68.7% | 1,862,987 | 2.76% | 5,151 |
| 20 | Rhode Island | 38,954 | 36,822 | 2,132 | 94.5% | 291,831 | 13.35% | 3,895 |
| 21 | Louisiana | 36,189 | 27,062 | 9,127 | 74.8% | 1,960,048 | 1.85% | 3,619 |
| 22 | Kentucky | 36,093 | 6,756 | 29,337 | 18.7% | 1,900,493 | 1.90% | 3,609 |
| 23 | South Carolina | 30,786 | 11,359 | 19,427 | 36.9% | 2,007,452 | 1.53% | 3,079 |
| 24 | Mississippi | 26,692 | 5,165 | 21,527 | 19.4% | 1,224,048 | 2.18% | 2,669 |
| 25 | Colorado | 24,017 | 21,046 | 2,971 | 87.6% | 1,911,596 | 1.26% | 2,402 |
| 26 | Arkansas | 19,233 | 12 | 19,221 | 0.1% | 1,358,791 | 1.42% | 1,923 |
| 27 | District of Columbia | 18,978 | 18,767 | 211 | 98.9% | 137,166 | 13.84% | 1,898 |
| 28 | Virginia | 18,404 | 4,929 | 13,475 | 26.8% | 2,358,463 | 0.78% | 1,840 |
| 29 | Oklahoma | 16,457 | 6,800 | 9,657 | 41.3% | 1,582,639 | 1.04% | 1,646 |
| 30 | North Carolina | 15,260 | 356 | 14,904 | 2.3% | 3,636,240 | 0.42% | 1,526 |
| 31 | West Virginia | 13,792 | 7,836 | 5,956 | 56.8% | 688,920 | 2.00% | 1,379 |
| 32 | California | 12,243 | 13 | 12,230 | 0.1% | 10,106,106 | 0.12% | 1,224 |
| 33 | Connecticut | 11,307 | 5,198 | 6,109 | 46.0% | 829,520 | 1.36% | 1,131 |
| 34 | North Dakota | 10,050 | 9,272 | 778 | 92.3% | 274,740 | 3.66% | 1,005 |
| 35 | Delaware | 9,431 | 4,038 | 5,393 | 42.8% | 339,429 | 2.78% | 943 |
| 36 | New Hampshire | 9,292 | 934 | 8,358 | 10.1% | 162,931 | 5.70% | 929 |
| 37 | Washington | 7,982 | 1,437 | 6,545 | 18.0% | 2,292,178 | 0.35% | 798 |
| 38 | Wyoming | 5,322 | 1,104 | 4,218 | 20.7% | 207,295 | 2.57% | 532 |
| 39 | Maryland | 5,048 | 420 | 4,628 | 8.3% | 1,488,814 | 0.34% | 505 |
| 40 | South Dakota | 5,031 | 3,435 | 1,596 | 68.3% | 322,981 | 1.56% | 503 |
| 41 | Montana | 4,037 | 614 | 3,423 | 15.2% | 284,995 | 1.42% | 404 |
| 42 | Idaho | 3,270 | 755 | 2,515 | 23.1% | 605,316 | 0.54% | 327 |
| 43 | Arizona | 3,048 | 0 | 3,048 | 0.0% | 2,586,124 | 0.12% | 305 |
| 44 | Maine | 2,017 | 35 | 1,982 | 1.7% | 291,124 | 0.69% | 202 |
| 45 | Vermont | 1,587 | 24 | 1,563 | 1.5% | 144,285 | 1.10% | 159 |
| 46 | Nevada | 1,270 | 0 | 1,270 | 0.0% | 1,013,166 | 0.13% | 127 |
| 47 | Utah | 1,022 | 308 | 714 | 30.1% | 1,001,436 | 0.10% | 102 |
| 48 | Hawaii | 419 | 0 | 419 | 0.0% | 305,725 | 0.14% | 42 |
| 49 | New Mexico | 409 | 21 | 388 | 5.1% | 663,724 | 0.06% | 41 |
| 50 | Virgin Islands | 329 | 0 | 329 | 0.0% | 36,075 | 0.91% | 33 |
| 51 | Puerto Rico | 218 | 6 | 212 | 2.8% | 1,467,599 | 0.01% | 22 |
| 52 | Oregon | 60 | 0 | 60 | 0.0% | 1,244,477 | 0.00% | 6 |
| 53 | Alaska | 4 | 0 | 4 | 0.0% | 125,838 | 0.00% | 0 |
Source: US EPA, 2025 Updated Service Line Projections, 7th DWINSA. Density and annual pace calculated by The Plumbing Brief.
What we calculated
Derived finding 1: a third of the national figure is galvanized pipe
Formula. Projected galvanized requiring replacement divided by the projected lead and galvanized subtotal.
Calculation. 1,296,400 divided by 3,956,383 equals 32.8 percent.
Finding. Just under a third of the number reported as lead service lines is galvanized pipe requiring replacement rather than lead pipe. EPA states this inclusion openly in its methodology; it is rarely carried through into coverage of the 4 million figure.
Inputs. US EPA, 2025 Updated Service Line Projections.
Limitations. Galvanized requiring replacement is a regulatory category, not a statement that the pipe contains lead. Whether a galvanized line qualifies depends on whether it was downstream of a lead component, which individual systems determine.
Derived finding 2: lead service line density by state
Formula. Projected lead and galvanized lines divided by total projected service lines in that jurisdiction.
Finding. Illinois is the most concentrated state in the country at 16.48 percent, roughly one service line in six. Wisconsin follows at 13.47 percent, Indiana at 12.50 percent, Michigan at 11.14 percent and Ohio at 11.08 percent. The national density is 3.84 percent.
Inputs. US EPA, 2025 Updated Service Line Projections.
Limitations. Density uses EPA’s projected total service line count as the denominator, which is itself modelled. States that reported more complete inventories may appear denser simply because they identified more of what they have.
Derived finding 3: the annual pace each state must hold
Formula. Projected lead and galvanized lines divided by ten years, from the 1 November 2027 compliance date to the 31 December 2037 deadline.
Finding. Illinois must average roughly 63,164 replacements a year, Ohio 40,656 and New York 38,339. Nationally the figure is approximately 395,638 a year.
Inputs. US EPA projections. US EPA Lead and Copper Rule Improvements.
Limitations. This is a flat average for illustration. The rule sets a minimum average of 10 percent per year per system on a three-year rolling average, not a uniform state pace, and certain systems have deferred or alternate schedules. Lines discovered during later validation would add to the total.
How this report was built
Methodology
Source. Every figure in the state table is taken directly from EPA’s 2025 Updated Service Line Projections spreadsheet, published alongside the 7th Drinking Water Infrastructure Needs Survey and Assessment. No state figure is estimated by this publication.
Calculated columns. Lead share, density and annual pace are calculated here from EPA’s own columns, using the formulas stated above. Homeowners weighing a full pipe swap may want background on galvanized pipe lifespan and replacement, while the methodology behind these figures is unpacked further in what the national lead pipe data shows.
Coverage. EPA’s table covers 56 states and territories. Three have no projected lead or galvanized lines and are omitted from the ranking. Territories are included where EPA reports them.
Relationship to the national report. This page breaks the same EPA projection down by state. The national context, including the revision from 9.2 million, the EPA Inspector General findings on the earlier questionnaire and the two data-gap adjustments in EPA’s method, is covered separately.
Last updated. 25 September 2026.
Data limitations
- These are projections, not verified counts. EPA models unknown-material lines into state totals using a state-specific ratio.
- Roughly a third of the national figure is galvanized pipe requiring replacement rather than lead pipe, and the split varies from 0.4 percent lead in Georgia to 92.9 percent in Wisconsin.
- Where a state submitted no inventory data for a water system, EPA’s method assumed that system’s connections were non-lead, which resolves missing data in a single direction.
- The figures cover community water systems eligible for state revolving fund money, not every water system in the country.
- Service line inventories are still being validated under the Lead and Copper Rule Improvements, so state counts may move again.
- The per-year column is arithmetic illustration, not a regulatory requirement. The rule’s actual pace requirement is set per system.
- This page reports federal data and is not legal advice. Water systems should work from the rule text and their state primacy agency.
Source quality ranking
Tier 1. US EPA, 2025 Updated Service Line Projections spreadsheet, 7th DWINSA. US EPA, 2025 Update to the 7th DWINSA fact sheet. US EPA, Lead and Copper Rule Improvements. US EPA, Lead and Copper Rule Revisions. US EPA, DWSRF allotments.
Tier 2. None used.
Tier 3. None used.
Excluded. Advocacy-organisation lead pipe estimates and any state figure not published by EPA.
If you quote one number
- Almost a third of America’s 4 million lead service lines are not lead. They are galvanized pipe requiring replacement.
- In Texas, only 4.2 percent of the projected figure is actually lead pipe. In Georgia it is 0.4 percent.
- Illinois has 631,642 lead and galvanized service lines, more than any other state, and roughly one service line in six.
- Illinois alone must replace about 63,164 service lines a year to meet the 2037 deadline.
- Nationally, 3.84 percent of all service lines are projected to be lead or galvanized requiring replacement.
Summary for reporters
EPA projects 3,956,383 lead and galvanized service lines requiring replacement across US states and territories, according to the agency’s 2025 Updated Service Line Projections published alongside the 7th Drinking Water Infrastructure Needs Survey and Assessment. Of that total, 2,659,983 are projected lead service lines and 1,296,400, or 32.8 percent, are galvanized pipe requiring replacement rather than lead. The split varies sharply by state. Wisconsin’s projection is 92.9 percent actual lead, while Georgia’s is 0.4 percent and Texas’s is 4.2 percent. Illinois holds the largest count at 631,642 and the highest density at 16.48 percent of all its service lines. Ohio follows at 406,565 and New York at 383,390. Nationally, 3.84 percent of the 102,958,322 projected service lines are lead or galvanized requiring replacement. Covered lines must be replaced by 31 December 2037.
Angles this supports
- A third of America’s lead pipes are not lead
- Illinois has more lead service lines than any state, and one in six of its connections
- In Texas, 96 percent of the lead pipe figure is galvanized steel
- What each state has to replace every year to hit the 2037 lead pipe deadline
- The lead pipe map is not where you think it is
Download the data
Every figure in the table above is published as a CSV under a Creative Commons Attribution 4.0 licence. Attribution: The Plumbing Brief.
EPA projections for all 53 jurisdictions with lead or galvanized pipe (CSV)
Questions this answers
How many lead service lines does my state have? The table above gives EPA’s projection for all 53 jurisdictions that have any. Illinois leads at 631,642, followed by Ohio at 406,565 and New York at 383,390.
Are all 4 million of them actually lead? No. EPA projects 2,659,983 lead service lines and 1,296,400 galvanized lines requiring replacement. Galvanized pipe is 32.8 percent of the headline figure.
Why does EPA count galvanized pipe as a lead service line? Because lead can adhere to galvanized steel, so galvanized pipe downstream of a lead component is treated as requiring replacement under the rule.
Which state has the highest concentration of lead pipes? Illinois, where 16.48 percent of all projected service lines are lead or galvanized requiring replacement, roughly one in six.
Which states are mostly galvanized rather than lead? Georgia at 0.4 percent lead, Texas at 4.2 percent, Alabama at 7.6 percent and Florida at 10.8 percent.
When do lead service lines have to be replaced? By 31 December 2037 under the Lead and Copper Rule Improvements, at a minimum average of 10 percent per year on a three-year rolling average from the 1 November 2027 compliance date.
How many replacements per year does that require? Nationally about 395,638 a year on a flat average. Illinois alone needs roughly 63,164 a year.
How much federal money is available? The Infrastructure Investment and Jobs Act appropriated 15 billion dollars specifically for lead service line replacement through the Drinking Water State Revolving Fund. That appropriation expires on 30 September 2026.
Are these numbers confirmed counts? No. They are projections. EPA models unknown-material lines into state totals, and where a state filed no inventory data for a system, EPA assumed that system was non-lead.
Where does the underlying data come from? Service line inventories that water systems were required to file under the Lead and Copper Rule Revisions, with an initial inventory deadline of 16 October 2024, compiled by EPA into the 2025 update to the 7th DWINSA.
Last reviewed: 2026-09-25.
How to cite this report
The Plumbing Brief, “Lead Service Lines by State: EPA Projections for All 53 Jurisdictions With Lead or Galvanized Pipe”, https://theplumbingbrief.com/lead-pipes-by-state/, accessed [date].


