The Lead Service Line Report: What EPA Data Actually Shows About America’s Lead Pipes (2026)
The short answer
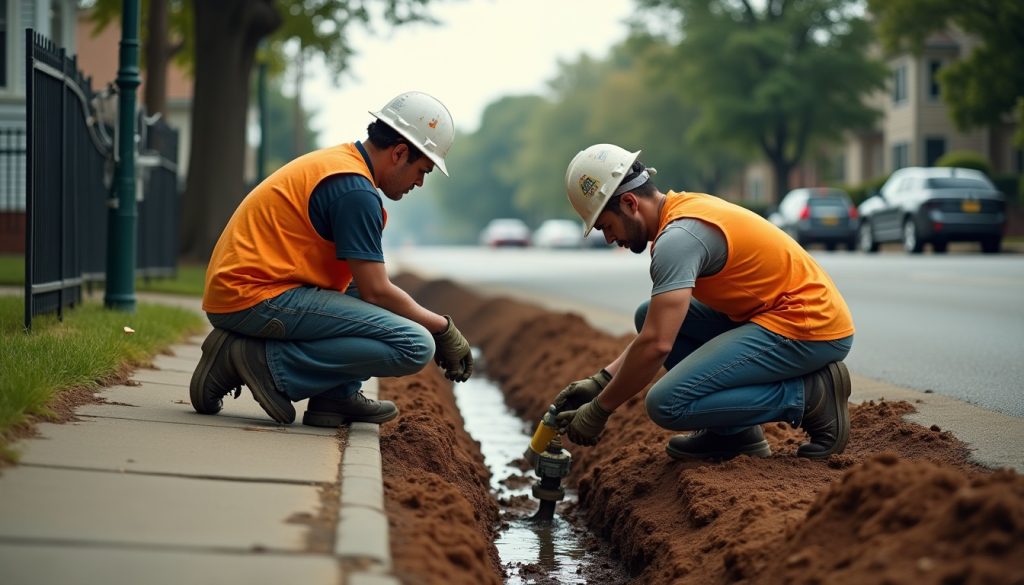
EPA projects 4.0 million lead service lines nationally in its November 2025 update, down from 9.2 million reported to Congress in 2023. The revision came from a change in method, not from pipe replacement. A quarter of the current figure is predicted rather than reported. That gap between predicted and reported lines matters most at the household level, where identifying lead pipes at home still starts with a scratch test and a magnet.
What this page is. A primary-sourced account of what federal data shows about lead service lines in the United States, built from EPA’s 2025 Update to the 7th Drinking Water Infrastructure Needs Survey and Assessment, the Lead and Copper Rule Improvements as published, EPA Office of Inspector General findings, and EPA funding allotment records. The national estimate changed substantially between 2023 and 2025. This page reports both figures, the methodology behind each, and the documented criticism of the underlying data, because presenting a single number without that context would misrepresent the state of the evidence. Anyone tracking how these estimates get reported should also see how lead testing in schools has its own data gaps, and how water main break figures get similarly miscited across the industry.
The short version
- EPA estimated 4.0 million projected lead service lines nationally in its November 2025 update to the 7th Drinking Water Infrastructure Needs Survey and Assessment.
- That figure consists of 3 million service lines reported as lead or galvanized requiring replacement, plus 1 million service lines reported as unknown material that EPA predicts to be lead.
- One quarter of the national estimate is therefore predicted rather than observed.
- The 2023 7th DWINSA Report to Congress projected 9.2 million lead service lines at a replacement cost of approximately 50 to 80 billion dollars in 2021 dollars. The 2025 figure is approximately 57 percent lower.
- The revision was driven by a methodology change, not by pipe replacement. EPA moved from extrapolating a 2021 questionnaire sent to a statistical sample of systems, to using service line inventories that water systems were required to submit under the Lead and Copper Rule Revisions.
- EPA’s Office of Inspector General reported in October 2024 that the earlier questionnaire lacked adequate internal controls and that flawed data could have resulted in nearly 1 billion dollars in questionable allotments.
- Under the Lead and Copper Rule Improvements, the lead action level falls from 0.015 to 0.010 milligrams per litre on 1 November 2027, and covered lead and galvanized lines must be replaced by 31 December 2037.
- Meeting that deadline from the 2025 estimate requires replacing approximately 400,000 service lines per year nationally for ten years.
What the sources actually say
- EPA projects 4.0 million total lead service lines nationally. Source: US EPA, Fact Sheet, 2025 Update to the 7th Drinking Water Infrastructure Needs Survey and Assessment, November 2025.
- That total comprises 3 million reported lead service lines and 1 million unknown-material lines predicted to be lead. Source: US EPA, 2025 Update to the 7th DWINSA, November 2025.
- EPA’s definition of a lead service line for this purpose includes galvanized pipe requiring replacement, on the basis that lead can adhere to galvanized steel. Source: US EPA, 2025 Update to the 7th DWINSA, November 2025.
- The 7th DWINSA Report to Congress, sent 6 September 2023, projected 9.2 million lead service lines. Source: US EPA, 7th DWINSA Report to Congress, 2023.
- That 2023 report estimated national replacement cost at approximately 50 to 80 billion dollars in 2021 dollars. Source: US EPA, 7th DWINSA Report to Congress, 2023.
- The 6th DWINSA had estimated approximately 1.4 million lead service lines requiring replacement over 20 years at 4.2 billion dollars in 2015 dollars, based on voluntary reporting by some systems. Source: US EPA, 6th DWINSA.
- States were required to report service line inventory information to EPA by 31 March 2025, with an update window to 30 June 2025. Source: US EPA, 2025 Update to the 7th DWINSA, November 2025.
- The underlying inventories were required under the Lead and Copper Rule Revisions, with an initial inventory deadline of 16 October 2024. Source: US EPA, Lead and Copper Rule Revisions.
- There were approximately 48,000 community water systems in US states and territories. Source: US EPA, 2025 Update to the 7th DWINSA, November 2025.
- EPA’s Office of Inspector General, in report 25-E-0002 dated 21 October 2024, found the lead service line questionnaire did not produce reliable data for distributing approximately 2.8 billion dollars in fiscal year 2023. Source: US EPA Office of Inspector General, Report 25-E-0002.
- The same OIG report stated the flawed data could have resulted in nearly 1 billion dollars in questionable lead service line allotments. Source: US EPA Office of Inspector General, Report 25-E-0002, 21 October 2024.
- The Infrastructure Investment and Jobs Act appropriated 15 billion dollars to the Drinking Water State Revolving Fund specifically for lead service line replacement. Source: US EPA, 2025 Update to the 7th DWINSA, November 2025.
- EPA announced approximately 2.875 billion dollars in fiscal year 2026 lead service line replacement allotments in May 2026, after Congress reduced the appropriation by 125 million dollars. Source: US EPA, FY2026 DWSRF LSLR allotments memorandum, May 2026.
- The lead action level falls from 0.015 to 0.010 milligrams per litre on 1 November 2027. Source: US EPA, Lead and Copper Rule Improvements, 2024.
- Covered lead and galvanized service lines must be replaced by 31 December 2037, at a minimum average of 10 percent per year on a three-year rolling average. Source: US EPA, Lead and Copper Rule Improvements, 2024.
Section 1: How the national estimate changed
The national lead service line estimate has moved substantially across four federal publications. The movement reflects changes in how the number was produced, not changes in the number of pipes in the ground. How many water systems currently test above the lead action level is counted in water systems over the lead action level.
| Publication | Date | National estimate | How it was produced |
|---|---|---|---|
| 6th DWINSA | 2015 dollars basis | approximately 1.4 million over 20 years | Voluntary cost reporting by some systems |
| 7th DWINSA Report to Congress | 6 September 2023 | 9.2 million | Questionnaire sent to a statistical sample of systems in 2021, extrapolated to state level |
| Updated 7th DWINSA, FY2024 basis | collected 2023 | see note | States updated their questionnaire responses, before LCRR inventories were due |
| 2025 Update to the 7th DWINSA | November 2025 | 4.0 million | State-submitted LCRR service line inventories |
Note. EPA describes the FY2024 basis as an update to questionnaire responses rather than publishing it as a separate headline national figure. This page does not assign it a national number.
Section 2: How EPA built the 4 million figure
EPA states its method plainly in the November 2025 fact sheet, and the method matters more than the headline. Two documented adjustments and one prediction step sit between the raw inventories and the published national number.
- Adjustment one. Where a state did not report any data for a water system’s inventory, EPA assumed all of that system’s service connections were non-lead.
- Adjustment two. Where a state did not report the number of non-lead service lines, which was optional to report, but reported everything else, EPA estimated non-lead lines as the difference between total service connections and reported service lines.
- Prediction step. For each state, EPA calculated the ratio of lead and galvanized-requiring-replacement lines to the total of lead, galvanized and non-lead lines, then multiplied that ratio by the number of reported unknown-material lines to predict how many unknowns are lead.
What this means. The first adjustment is directional. Where inventory data is missing entirely, the method treats the gap as non-lead rather than as unknown. A method that resolves missing data toward non-lead will produce a lower national total than one that treats missing data as unresolved. EPA documents this choice openly in its own fact sheet.
How the money follows. EPA allots Drinking Water State Revolving Fund lead service line money according to each state’s share of the projected national total, with every state receiving a statutory minimum of 1 percent of available funding.
Section 3: The federal oversight finding
EPA’s Office of Inspector General examined the questionnaire that produced the earlier 9.2 million estimate and the fiscal year 2023 allotments derived from it.
In report 25-E-0002, published 21 October 2024, the OIG concluded that the lead service line questionnaire was originally designed to estimate replacement costs rather than to allot funds, and that it lacked the internal controls needed to ensure data quality and reliability for that second purpose. The OIG reported that this affected the distribution of approximately 2.8 billion dollars in fiscal year 2023 and could have resulted in nearly 1 billion dollars in questionable allotments.
Why this belongs in any citation of the figures. The OIG finding is a federal oversight body assessing a federal dataset. It does not establish that either the 9.2 million or the 4.0 million figure is wrong. It establishes that the earlier data carried documented quality problems, which is part of why EPA changed methods.
Section 4: Where the evidence is genuinely mixed
Two questions in this subject do not have a settled answer. Reporting either as settled would misrepresent the record.
The national count. EPA’s current projection is 4.0 million. EPA’s 2023 projection was 9.2 million. The Natural Resources Defense Council published an independent estimate of 9.7 to 12.8 million in 2021 and has publicly questioned the downward revision. These figures were produced by different methods at different times and are not reconcilable into a single number. The honest statement is that the federal projection currently stands at 4.0 million, that it replaced a figure more than twice as large, and that the change came from method rather than from replacement work.
The per-line replacement cost. Published estimates diverge by roughly a factor of two.
| Source | Average per line | Stated range | Scope noted |
|---|---|---|---|
| US EPA | 4,700 dollars | 1,200 to 12,300 dollars | Per line |
| American Water Works Association | more than 10,000 dollars | 8,247 to 12,000 dollars and above | Includes mobilisation, street restoration, private-side coordination and contingency |
The two are not necessarily contradictory. AWWA states a broader cost scope. Anyone citing a per-line cost should state which scope the figure covers.
Section 5: The regulatory clock
| Date | Requirement | Authority |
|---|---|---|
| 16 October 2024 | Initial service line inventory due | Lead and Copper Rule Revisions |
| 31 March 2025 | State inventory information due to EPA | EPA DWINSA data collection |
| 30 June 2025 | State update window closes | EPA DWINSA data collection |
| 1 November 2027 | Lead action level falls to 0.010 mg/L; systems transition to LCRI compliance | Lead and Copper Rule Improvements |
| 1 November 2027 onward | Replacement at a minimum average of 10 percent per year, three-year rolling average | Lead and Copper Rule Improvements |
| 31 December 2037 | Covered lead and galvanized service lines replaced | Lead and Copper Rule Improvements |

Our checks
The following findings are calculated by this publication from the sources cited. Each states its formula, inputs and limitations. None applies a weighting that cannot be sourced.
Derived finding 1: A quarter of the national estimate is predicted, not reported
Formula. Predicted lead service lines divided by total projected lead service lines.
Calculation. 1 million divided by 4 million equals 25 percent.
Finding. Twenty-five percent of EPA’s national lead service line projection consists of unknown-material lines that a state-level ratio predicts to be lead, rather than lines a water system reported as lead.
Inputs. US EPA, 2025 Update to the 7th DWINSA, November 2025.
Limitations. The predicted share varies by state because EPA applies a state-specific ratio. This is a national figure and does not describe any individual state.
Derived finding 2: The estimate fell 57 percent without a pipe being pulled
Formula. Change between the 2023 and 2025 national projections, divided by the 2023 projection.
Calculation. 9.2 million minus 4.0 million equals 5.2 million. 5.2 divided by 9.2 equals 56.5 percent.
Finding. The federal national projection fell approximately 57 percent between September 2023 and November 2025. EPA attributes the change to a shift from extrapolated questionnaire sampling to reported service line inventories, not to replacement activity.
Inputs. US EPA, 7th DWINSA Report to Congress, 2023. US EPA, 2025 Update to the 7th DWINSA, November 2025.
Limitations. The two figures were produced by different methods and are not a time series. This calculation measures the size of a methodological revision. It does not measure a reduction in lead pipes.
Derived finding 3: The 2037 deadline requires about 400,000 replacements a year
Formula. Total projected lead service lines divided by the years between the compliance date and the replacement deadline.
Calculation. 4 million divided by 10 years equals 400,000 per year.
Finding. Replacing the currently projected national total between the 1 November 2027 compliance date and the 31 December 2037 deadline requires approximately 400,000 service line replacements per year nationally. Hitting that pace depends on contractor capacity and funding mechanisms outlined in the lead pipe replacement rule, which sets the compliance framework utilities must follow.
Inputs. US EPA, 2025 Update to the 7th DWINSA, November 2025. US EPA, Lead and Copper Rule Improvements, 2024.
Limitations. This is a flat national average. The rule sets a minimum average of 10 percent per year per system on a three-year rolling average, not a uniform national pace, and certain systems have deferred or alternate schedules. Lines discovered after inventory validation would add to the total.
Derived finding 4: Federal funding per projected line, against two cost estimates
Formula. IIJA lead service line appropriation divided by projected lines, compared against published per-line cost estimates.
Calculation. 15 billion dollars divided by 4 million lines equals 3,750 dollars per projected line. Against EPA’s 4,700 dollar average, that is 80 percent of the per-line cost. Against AWWA’s figure of more than 10,000 dollars, that is approximately 37 percent.
Finding. Dedicated IIJA funding equates to approximately 3,750 dollars per projected lead service line. Whether that is sufficient depends entirely on which per-line cost estimate is used, and the two published estimates differ by roughly a factor of two.
Inputs. US EPA, 2025 Update to the 7th DWINSA, November 2025. US EPA per-line cost estimate. American Water Works Association per-line cost estimate.
Limitations. The IIJA appropriation is not the only funding source. General Drinking Water State Revolving Fund money, state programmes and utility rates also fund replacement. This ratio does not represent total available funding per line, and this page does not conclude whether funding is adequate.
Recommended charts
- The national estimate across four federal publications. Data: 1.4 million, 9.2 million, 4.0 million with dates and method labels. Source: EPA DWINSA publications. Insight: the estimate tracks methodology, not pipe. Citation-worthy because it shows why two accurate citations can disagree.
- Reported against predicted within the 4 million. Data: 3 million reported, 1 million predicted. Source: EPA, November 2025. Insight: a quarter of the figure is modelled.
- Required replacement pace against the deadline. Data: 400,000 per year, 2027 to 2037. Sources: EPA DWINSA; LCRI. Insight: the scale of the annual obligation.
- Per-line funding against the two cost estimates. Data: 3,750 dollars available, 4,700 dollar EPA estimate, 10,000 dollar AWWA estimate. Insight: the funding gap depends on whose cost figure applies.
How this report was built
Methodology
Source selection. Figures come from EPA publications, EPA Office of Inspector General reports, and the rule text as published. Where a trade body figure is used, it is identified as such and its scope is stated.
Inclusion rules. A statistic is included only where a named source states it and a date is attached. Statistics appearing only in secondary summaries without a traceable primary source were excluded.
Handling conflicting numbers. This subject contains two genuine conflicts, and both are reported as conflicts rather than resolved. The national count is reported as a current federal projection of 4.0 million alongside the 9.2 million figure it replaced, with the methodology change stated. Per-line cost is reported as two figures from two named organisations with their differing scopes stated. This page does not average conflicting figures or select one without saying so.
Estimates. The four derived findings are calculated by this publication. Each states its formula and inputs.
Last updated. 18 September 2026.
Data limitations
- One quarter of the 4.0 million national figure is predicted from a state-level ratio rather than reported by a water system.
- Where a state submitted no inventory data for a water system, EPA’s method assumed that system’s connections were non-lead. This resolves missing data in a single direction.
- The figure covers community water systems eligible for Drinking Water State Revolving Fund money. It does not describe every water system in the United States.
- The 9.2 million and 4.0 million figures were produced by different methods. They are not two points on a trend line and should never be presented as a reduction achieved over time.
- EPA’s Office of Inspector General identified data quality and internal control problems in the questionnaire that produced the earlier estimate and the fiscal year 2023 allotments.
- Service line inventories are still being validated. The Lead and Copper Rule Improvements require systems to validate certain unknown lines on a later schedule, so state and national counts may move again.
- Per-line cost estimates differ by roughly a factor of two between EPA and AWWA, partly because they cover different scopes of work.
- This page reports regulatory dates as published. It is not legal advice and water systems should work from the rule text and their state primacy agency.
Source quality ranking
Tier 1. US EPA, Fact Sheet, 2025 Update to the 7th DWINSA, November 2025. US EPA, 7th DWINSA Report to Congress, 2023. US EPA Office of Inspector General Report 25-E-0002, 21 October 2024. Lead and Copper Rule Revisions and Lead and Copper Rule Improvements as published. US EPA DWSRF allotment memoranda. Infrastructure Investment and Jobs Act.
Tier 2. American Water Works Association per-line cost estimates.
Tier 3. Natural Resources Defense Council independent estimate and published commentary, used only to show that the federal revision is contested and identified as advocacy-organisation analysis.
Excluded. Unsourced statistics roundups and any figure whose original source could not be reached and read.
The corrected figure to use
- EPA now projects 4.0 million lead service lines in the United States, down from 9.2 million in 2023, a change EPA attributes to methodology rather than to replacement work.
- One quarter of the 4.0 million figure is not reported lead pipe. It is unknown-material pipe predicted to be lead by a state-level ratio.
- Where a state filed no inventory data for a water system, EPA’s method assumed that system had no lead.
- Meeting the 2037 deadline requires replacing roughly 400,000 service lines a year, every year, for a decade.
- EPA’s Inspector General found that flawed questionnaire data could have produced nearly 1 billion dollars in questionable allotments.
Correction summary
The US Environmental Protection Agency projects 4.0 million lead service lines nationally in its November 2025 update to the 7th Drinking Water Infrastructure Needs Survey and Assessment. That figure is approximately 57 percent below the 9.2 million the agency reported to Congress in September 2023. EPA attributes the change to a shift in method, moving from a questionnaire sent to a statistical sample of water systems in 2021 to service line inventories that systems were required to file under the Lead and Copper Rule Revisions. No part of the reduction is attributed to pipe replacement. Three million lines were reported as lead or as galvanized requiring replacement. The remaining 1 million are unknown-material lines that EPA predicts to be lead using a state-level ratio. Where a state filed no inventory data for a system, EPA assumed that system’s connections were non-lead. EPA’s Office of Inspector General reported in October 2024 that the earlier questionnaire lacked adequate internal controls. Covered lines must be replaced by 31 December 2037.
How to frame it
- America’s lead pipe count fell by more than half without a single pipe being replaced
- A quarter of the federal lead pipe estimate is prediction, not measurement
- Where states filed no data, EPA assumed there was no lead
- The 2037 lead pipe deadline needs 400,000 replacements a year starting in 2027
- EPA’s own watchdog flagged nearly 1 billion dollars in questionable lead pipe allotments
Questions about the correction
How many lead service lines are there in the United States? EPA projects 4.0 million as of its November 2025 update to the 7th DWINSA. That figure includes galvanized pipe requiring replacement.
Why did the lead pipe estimate drop from 9.2 million to 4 million? EPA changed method. The 2023 figure was extrapolated from a questionnaire sent to a statistical sample of water systems in 2021. The 2025 figure uses service line inventories that systems were required to file under the Lead and Copper Rule Revisions. EPA does not attribute the change to replacement work.
How much of the 4 million figure is actually confirmed lead pipe? 3 million lines were reported as lead or galvanized requiring replacement. The remaining 1 million are unknown-material lines predicted to be lead using a state-specific ratio.
When must lead service lines be replaced? Covered lead and certain galvanized lines must be replaced by 31 December 2037 under the Lead and Copper Rule Improvements, at a minimum average of 10 percent per year on a three-year rolling average from the 1 November 2027 compliance date.
What is the lead action level in drinking water? It falls from 0.015 milligrams per litre to 0.010 milligrams per litre on 1 November 2027 under the Lead and Copper Rule Improvements.
How much federal money is available for lead service line replacement? The Infrastructure Investment and Jobs Act appropriated 15 billion dollars to the Drinking Water State Revolving Fund specifically for lead service line replacement. EPA announced approximately 2.875 billion dollars in fiscal year 2026 allotments in May 2026.
How much does it cost to replace one lead service line? Estimates differ. EPA has used an average of 4,700 dollars per line with a range of 1,200 to 12,300 dollars. AWWA puts the figure above 10,000 dollars when mobilisation, street restoration, private-side coordination and contingency are included.
How many service lines have unknown material? Unknown-material lines are reported by state in EPA’s service line inventory data within the Safe Drinking Water Information System. EPA predicted 1 million of them to be lead in the 2025 update. This page does not state a national unknown total, because published figures for it vary by vintage and scope.
Did EPA’s own watchdog criticise this data? Yes. In report 25-E-0002 dated 21 October 2024, EPA’s Office of Inspector General found the lead service line questionnaire lacked the internal controls needed for allotting funds and that flawed data could have resulted in nearly 1 billion dollars in questionable allotments.
Where can I find the count for my state? EPA publishes state-level projected lead service line counts on its 7th DWINSA dashboard, and the underlying inventory data sits in EPA’s service line inventory report within the Safe Drinking Water Information System Federal Reporting Services site.
Last reviewed: 2026-09-18.
How to cite this report
The Plumbing Brief, “The Lead Service Line Report: What EPA Data Actually Shows About America’s Lead Pipes (2026)”, https://theplumbingbrief.com/lead-service-line-report/, accessed [date].


