Water and Sewer Bill Inflation: 838 Percent Since 1980, and 146 Percent After Inflation
The short answer
The consumer price index for water and sewerage maintenance rose 838 percent between 1980 and 2024. All consumer prices rose 281 percent over the same period. That leaves a real increase of 146 percent, meaning water and sewer service costs roughly two and a half times what it did in 1980 after general inflation.
What the 45-year series shows
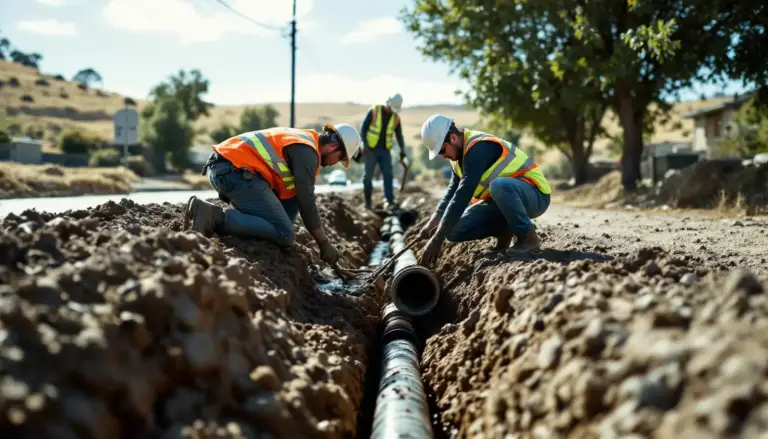
The Bureau of Labor Statistics has tracked water and sewerage maintenance as a distinct consumer price index component since 1980. That makes it possible to separate the nominal rise, which is mostly general inflation, from the real rise, which is the part households actually felt as water becoming more expensive relative to everything else. The capital backlog behind rising sewer charges is documented in EPA wastewater needs by state.
Both are large. The real figure is the one worth citing.
The decade pattern
Water and sewer prices outpaced general inflation in every decade from 1980 to 2020. The 2020s are the first period in the series where they did not.
| Period | Water and sewerage | All items | Difference |
|---|---|---|---|
| 1980 to 1990 | +103.0% | +58.6% | +44.4 points |
| 1990 to 2000 | +51.5% | +31.8% | +19.7 points |
| 2000 to 2010 | +67.3% | +26.6% | +40.7 points |
| 2010 to 2020 | +53.8% | +18.7% | +35.1 points |
| 2020 to 2024 | +18.5% | +21.2% | -2.7 points |
Source: BLS CPI series CUUR0000SEHG01 and CUUR0000SA0, annual averages of complete years.
What this means. The 2020s break a 40-year pattern. During the 2021 and 2022 inflation surge, water and sewer prices rose more slowly than consumer prices generally, because rate increases are set by regulatory and municipal processes that move on multi-year cycles rather than responding to market conditions within a year. That lag works in both directions, and it is the most likely reason the series fell behind.
The evidence
- Water and sewerage CPI, 1980 annual average: 74.0. Source: BLS series CUUR0000SEHG01.
- Water and sewerage CPI, 2024 annual average: 693.7. Source: BLS series CUUR0000SEHG01.
- Nominal change 1980 to 2024: plus 838 percent. Source: calculated from BLS CPI.
- All items CPI over the same period: 82.4 to 313.7, a rise of 281 percent. Source: BLS series CUUR0000SA0.
- Real change after general inflation: plus 146 percent. Source: calculated from BLS CPI.
- Fastest decade: 1980 to 1990 at plus 103.0 percent. Source: calculated from BLS CPI.
- Largest gap against general inflation: 1980 to 1990, 44.4 percentage points. Source: calculated from BLS CPI.
- Second largest gap: 2000 to 2010, 40.7 points. Source: calculated from BLS CPI.
- Only period where water and sewer rose more slowly than all items: 2020 to 2024, by 2.7 points. Source: calculated from BLS CPI.
- Most recent monthly reading: 765.5 in August 2026. Source: BLS series CUUR0000SEHG01.
- Garbage and trash collection, the closest comparable municipal service, rose 496 percent from 1984 to 2024, a real increase of 97 percent. Source: BLS series CUUR0000SEHG02.
- US drinking water infrastructure need over 20 years: 625 billion dollars. Source: US EPA, 7th DWINSA, 2023.
What we calculated
The real increase, which is the figure most coverage omits
Formula. Water and sewerage index growth divided by all items index growth, minus one.
Calculation. 693.7 divided by 74.0 equals 9.38. 313.7 divided by 82.4 equals 3.81. 9.38 divided by 3.81 equals 2.46, a real increase of 146 percent.
Finding. Water and sewer service costs about 2.46 times what it did in 1980 in real terms. The 838 percent headline figure is mostly general inflation. The 146 percent is the part that represents water genuinely becoming more expensive relative to household budgets.
Limitations. The CPI tracks prices paid by urban consumers nationally. It is not a bill. Actual water bills depend on local rates, consumption and fixed charges, and vary far more between utilities than this national series varies over time.
The 2020s break the pattern
Formula. Decade-over-decade growth in both series, compared.
Finding. Water and sewer prices beat general inflation by between 19.7 and 44.4 percentage points in each of the four decades from 1980 to 2020, then fell 2.7 points behind in the 2020 to 2024 period. This is the only reversal in the 45-year record.
Limitations. 2020 to 2024 is a four-year window, not a decade, and is not directly comparable to the ten-year periods above it. The reversal may also be temporary: the most recent monthly reading of 765.5 in August 2026 is 10.3 percent above the 2024 annual average, which is faster than general prices over the same span.
Water has outpaced the other municipal service too
Formula. Real change in water and sewerage compared against garbage and trash collection, the nearest comparable municipal utility in the CPI.
Calculation. Water and sewerage plus 146 percent real since 1980. Garbage and trash plus 97 percent real since 1984.
Finding. Both municipal services have risen sharply in real terms, and water has risen faster. This suggests the driver is not simply municipal cost inflation generally, because the two services would otherwise track more closely.
Limitations. The two series start four years apart, and 1980 to 1984 was a high-inflation period, so the comparison understates the garbage series’ full rise. This is an indicative comparison, not a matched one.
Download the data
The full 1980 to 2024 annual series for both indexes, with each rebased to 1980 equals 100, published as a CSV under a Creative Commons Attribution 4.0 licence. Attribution: The Plumbing Brief.
Water and sewer CPI against all items, 1980 to 2024 (CSV)
How this report was built
Methodology
Source. BLS Consumer Price Index for All Urban Consumers, series CUUR0000SEHG01 (water and sewerage maintenance), CUUR0000SEHG02 (garbage and trash collection) and CUUR0000SA0 (all items), retrieved through the BLS public API on 3 October 2026.
Annual figures. Each year is the mean of twelve published monthly values. Years with fewer than twelve complete months are excluded, which is why the series ends at 2024 rather than 2025.
Real change. Nominal index growth divided by all-items index growth over the same period. This is a deflation by headline CPI, not a chained or alternative measure.
Series start. The water and sewerage series begins in 1980 in this retrieval. Garbage and trash begins in 1984. Neither start date is a choice made here.
Retrieval date. 3 October 2026. Latest monthly value: August 2026.
Data limitations
- A price index is not a bill. Local rates, consumption and fixed charges determine what a household actually pays, and vary far more between utilities than this series varies over time.
- The CPI covers urban consumers. Rural water systems, which are smaller and often costlier per connection, are underrepresented.
- Deflating by headline CPI is one choice among several. Using a different deflator would change the real figure.
- The 2020 to 2024 period is four years and is not comparable to the ten-year periods shown above it.
- Index values are rebased here for presentation. BLS publishes them on a 1982 to 1984 base.
- This page does not identify why water prices rose. Infrastructure replacement, regulatory compliance, declining consumption spreading fixed costs across fewer units, and local financing decisions are all plausible contributors and none is tested here.
Source quality ranking
Tier 1. US Bureau of Labor Statistics, Consumer Price Index, series CUUR0000SEHG01, CUUR0000SEHG02 and CUUR0000SA0. US EPA, 7th Drinking Water Infrastructure Needs Survey and Assessment.
Tier 2. None used. Tier 3. None used.
Excluded. Average bill figures from utility surveys, which measure a different quantity and are not comparable with a price index.
If you quote one number
- Water and sewer prices rose 838 percent between 1980 and 2024, against 281 percent for consumer prices generally.
- After inflation, water and sewer service costs 146 percent more than it did in 1980.
- Water beat general inflation in every decade from 1980 to 2020, by between 19.7 and 44.4 percentage points.
- The 2020s are the first period in 45 years where water and sewer prices rose more slowly than everything else.
- Garbage collection rose 97 percent in real terms over a similar period. Water rose 146 percent.
Summary for reporters
The consumer price index for water and sewerage maintenance rose 838 percent between 1980 and 2024, from 74.0 to 693.7, according to Bureau of Labor Statistics data. All consumer prices rose 281 percent over the same period, which leaves a real increase of 146 percent after general inflation. Water and sewer prices outpaced general inflation in every decade from 1980 to 2020, with the largest gap in the 1980s at 44.4 percentage points and the second largest in the 2000s at 40.7 points. The 2020 to 2024 period is the first in the 45-year record where water and sewer prices rose more slowly than consumer prices generally, by 2.7 points, most plausibly because utility rate setting moves on multi-year regulatory cycles rather than responding to inflation within a year. The most recent monthly reading, August 2026, is 10.3 percent above the 2024 annual average.
Angles this supports
- Water bills have risen two and a half times faster than everything else since 1980
- The 2020s are the first decade water bills did not outrun inflation
- Water has outpaced even garbage collection in real terms
- The 838 percent figure is mostly inflation. The real number is 146 percent
- Forty-five years of water price data in one table
Questions this answers
How much have water bills gone up since 1980? The water and sewerage CPI rose 838 percent between 1980 and 2024. After general inflation the real increase is 146 percent.
Is water getting more expensive faster than other things? Yes, over the full period. Water and sewer rose 838 percent against 281 percent for all consumer prices.
Which decade saw the biggest water price rise? The 1980s, at plus 103.0 percent, which was also the largest gap against general inflation at 44.4 percentage points.
Did water prices outrun inflation during the 2021 and 2022 surge? No. Between 2020 and 2024 water and sewer rose 18.5 percent against 21.2 percent for all items, the only reversal in the series.
Why would water prices lag during an inflation surge? Utility rates are set through regulatory and municipal processes that move on multi-year cycles rather than responding within a year. This page notes that as the most plausible explanation but does not test it.
What is the most recent reading? 765.5 in August 2026, which is 10.3 percent above the 2024 annual average.
Does this mean my water bill rose 838 percent? No. A price index is not a bill. Local rates, consumption and fixed charges determine what any household pays, and those vary far more between utilities than this national series varies over time.
How does water compare with electricity and gas? Very differently. Electricity and piped gas have both fallen slightly in real terms since 1980 while water rose 146 percent. We cover that comparison separately.
What is driving the increase? This page does not establish a cause. Infrastructure replacement, regulatory compliance, falling consumption spreading fixed costs across fewer billed units, and local financing are all plausible and none is tested here.
Where does the data come from? BLS CPI series CUUR0000SEHG01 for water and sewerage maintenance and CUUR0000SA0 for all items, retrieved 3 October 2026.
How to cite this report
The Plumbing Brief, “Water and Sewer Bill Inflation: 838 Percent Since 1980, and 146 Percent After Inflation”, https://theplumbingbrief.com/water-sewer-bill-inflation/, accessed [date].
Last reviewed: 2026-10-03.