Wastewater Infrastructure Needs by State: EPA’s $630 Billion Sewer and Septic Bill
The short answer
US communities need $630.1 billion over 20 years to fix and expand wastewater, stormwater and related clean-water infrastructure, according to EPA’s 2022 Clean Watersheds Needs Survey. $97.4 billion of it is for replacing and rehabilitating deteriorating sewer pipes and $74.7 billion for septic and other decentralized systems. Per resident, needs range from $6,182 in West Virginia to $171 in Nevada.
What the table shows
Every few years EPA asks states to document the capital projects their wastewater and stormwater systems will need over the next 20 years. The 2022 survey, reported to Congress in 2024, is the first since 2012. It is the basis for federal funding allocations, and it explains much of what is pushing sewer bills up: old pipes, overflows, treatment upgrades and growth. Totals are in January 2022 dollars.
| Need category (national) | $ billions | Share |
|---|---|---|
| Secondary wastewater treatment | $66.6 | 10.6% |
| Advanced wastewater treatment | $83.6 | 13.3% |
| Conveyance system repair (sewer pipes) | $110.1 | 17.5% |
| New conveyance systems | $41.0 | 6.5% |
| Combined sewer overflow correction | $36.5 | 5.8% |
| Stormwater management | $115.3 | 18.3% |
| Nonpoint source control | $94.4 | 15.0% |
| Water reuse | $7.7 | 1.2% |
| Decentralized wastewater (septic) | $74.7 | 11.9% |
| Desalination | $0.2 | 0.0% |
| Total | $630.1 | 100% |
Source: EPA, 2022 Clean Watersheds Needs Survey Report to Congress, Table 1 and Table B-1 (January 2022 dollars).
| State | Total needs | Per resident | Sewer replacement and rehabilitation | Septic and decentralized |
|---|---|---|---|---|
| California | $65.53B | $1,657 | $12,460M | $3,382M |
| New York | $53.92B | $2,669 | $4,447M | $6,689M |
| Florida | $46.56B | $2,162 | $4,841M | $8,264M |
| Virginia | $45.77B | $5,303 | $3,640M | $3,052M |
| Louisiana | $26.90B | $5,776 | $876M | $1,125M |
| Georgia | $25.57B | $2,387 | $4,153M | $6,017M |
| Massachusetts | $21.71B | $3,088 | $1,834M | $275M |
| North Carolina | $21.14B | $2,025 | $4,904M | $5,160M |
| Ohio | $20.55B | $1,742 | $5,040M | $2,199M |
| New Jersey | $19.35B | $2,083 | $1,724M | $2,916M |
| Colorado | $19.17B | $3,320 | $2,333M | NR |
| Texas | $18.86B | $647 | $2,265M | $7,222M |
| Washington | $18.63B | $2,417 | $4,091M | $1,730M |
| Michigan | $15.07B | $1,496 | $1,936M | $1,572M |
| Pennsylvania | $12.77B | $982 | $1,023M | $46M |
| Iowa | $12.30B | $3,855 | $326M | $2,370M |
| New Mexico | $12.28B | $5,799 | $599M | $938M |
| Wisconsin | $12.01B | $2,038 | $1,266M | $3,553M |
| Illinois | $11.38B | $888 | $1,414M | NR |
| West Virginia | $11.09B | $6,182 | $1,305M | $912M |
| Maryland | $10.66B | $1,725 | $2,061M | $236M |
| Indiana | $10.13B | $1,493 | $956M | $1,187M |
| Connecticut | $9.82B | $2,725 | $1,080M | $1,468M |
| Utah | $9.73B | $2,973 | $2,305M | $1,329M |
| Missouri | $9.10B | $1,479 | $615M | $5M |
| Kentucky | $7.48B | $1,661 | $1,205M | $21M |
| South Carolina | $7.35B | $1,436 | $2,568M | $1,753M |
| Minnesota | $6.72B | $1,177 | $1,207M | $3,131M |
| Oregon | $5.54B | $1,308 | $1,441M | $33M |
| Arkansas | $5.45B | $1,811 | $816M | $533M |
| Arizona | $4.78B | $669 | $1,571M | $27M |
| New Hampshire | $4.29B | $3,112 | $726M | $1,252M |
| Kansas | $4.24B | $1,443 | $306M | $892M |
| Alabama | $4.03B | $801 | $1,010M | $1,380M |
| Maine | $4.00B | $2,932 | $456M | $1,709M |
| Tennessee | $3.85B | $557 | $1,208M | $2M |
| Oklahoma | $3.44B | $868 | $360M | $1,273M |
| Hawaii | $3.34B | $2,292 | $1,424M | NR |
| Nebraska | $3.17B | $1,617 | $377M | NR |
| North Dakota | $2.62B | $3,364 | $366M | $239M |
| Idaho | $2.59B | $1,406 | $386M | NR |
| Rhode Island | $2.48B | $2,264 | $295M | $449M |
| District of Columbia | $2.22B | $3,220 | $1,332M | NR |
| Vermont | $2.10B | $3,272 | $74M | $98M |
| Mississippi | $1.93B | $653 | $381M | NR |
| Delaware | $1.26B | $1,278 | $637M | NR |
| South Dakota | $1.12B | $1,258 | $118M | NR |
| Alaska | $0.78B | $1,057 | $230M | $0M |
| Wyoming | $0.70B | $1,213 | $212M | $1M |
| Nevada | $0.53B | $171 | $46M | $3M |
| Montana | $0.35B | $320 | $57M | $1M |
Source: EPA 2022 CWNS Report to Congress, Table 2 (totals and per capita), Table B-2 (category III-B, sewer replacement and rehabilitation) and Table B-1 (category XII, decentralized wastewater treatment). NR: not reported. Territories are in the CSV.
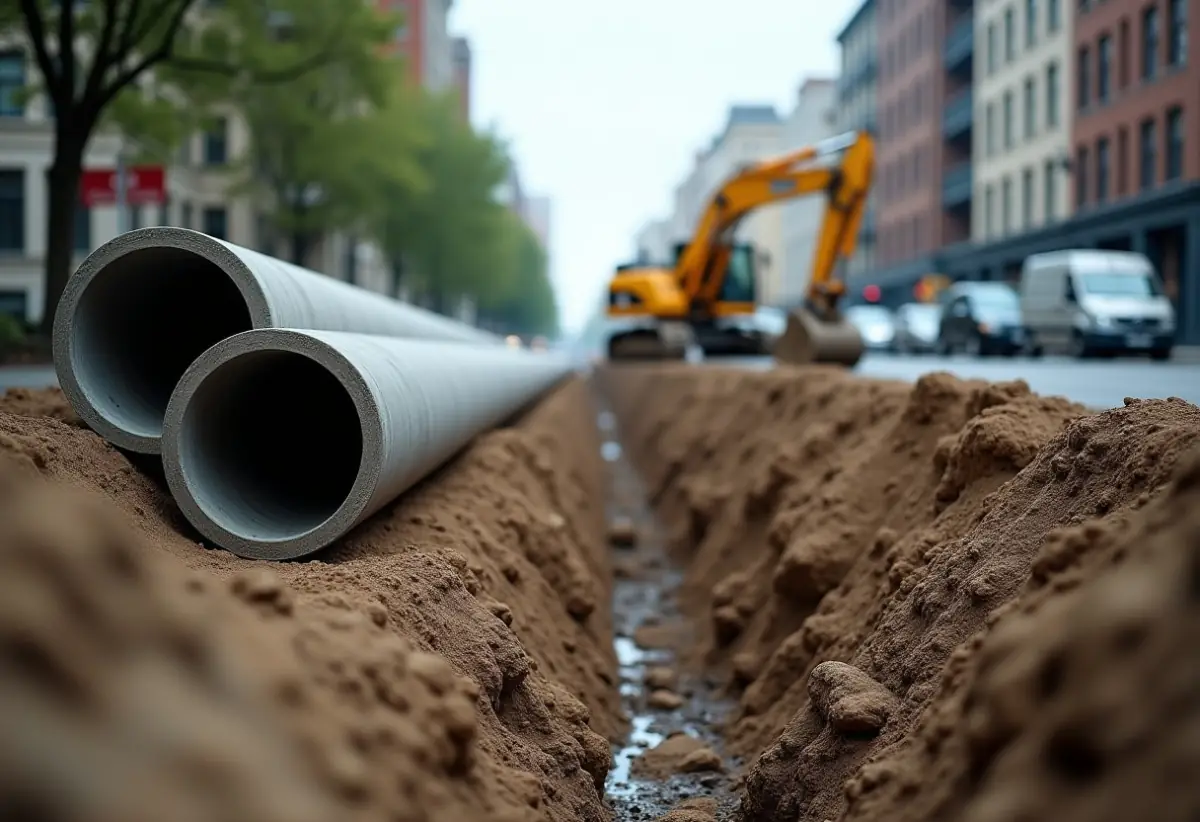
Sourced figures
- Total reported needs, 2022 to 2041: $630.1 billion. Source: EPA CWNS 2022.
- Sewer replacement and rehabilitation (category III-B): $97.4 billion; infiltration and inflow correction (III-A): $12.6 billion. Source: EPA CWNS Table B-2.
- New collector sewers (IV-A): $27.4 billion; new interceptors (IV-B): $13.6 billion. Source: EPA CWNS Table B-2.
- Decentralized wastewater treatment, mostly septic systems (XII): $74.7 billion. Source: EPA CWNS Table 1.
- Largest state totals: California $65.5B, New York $53.9B, Florida $46.6B, Virginia $45.8B, Louisiana $26.9B. Source: EPA CWNS Table 2.
- Highest per resident: West Virginia $6,182, New Mexico $5,799, Louisiana $5,776, Virginia $5,303. Lowest: Nevada $171. Source: EPA CWNS Table 2.
- Largest septic and decentralized needs: Florida $8,264M, Texas $7,222M, New York $6,689M, Georgia $6,017M. Source: EPA CWNS Table B-1.
- EPA states the total “likely underestimates the true nationwide need”, in part because states reported mainly near-term projects and had uneven resources for the survey. Source: EPA CWNS Report to Congress, section 1.
What we calculated
Old sewer pipes are the single largest wastewater need
Formula. Sewer replacement and rehabilitation (III-B) against every other wastewater subcategory.
Calculation. III-B $97.4 billion; advanced treatment (II) $83.6 billion; secondary treatment (I) $66.6 billion.
Finding. Fixing deteriorating sewer pipes outranks every treatment-plant category. For homeowners that matters twice: utilities pass these costs into sewer bills, and the same aging collection systems are what fail at the property line.
Limitations. Categories are as documented by states; a project can only sit in one category.
Per-resident needs vary more than thirtyfold
Formula. Highest state per-capita need divided by the lowest.
Calculation. West Virginia $6,182 / Nevada $171 = 36.
Finding. Some of the gap is real (old combined sewers, coastal rebuilding, rural septic) and some is reporting effort: EPA notes states had very different resources for documenting needs. Low figures should not be read as low need. Our guide to how a septic system works explains the tank and drain field that rural homes rely on instead of a sewer main.
Limitations. EPA cautions that state totals reflect documentation effort as well as need.
If you quote one number
- EPA puts US clean-water infrastructure needs at $630.1 billion over 20 years (2022 survey).
- $97.4 billion is for replacing and rehabilitating old sewer pipes.
- $74.7 billion is for septic and other decentralized systems.
Download the data
All states and territories, every wastewater subcategory, septic needs and 2008 and 2012 totals. Published under a Creative Commons Attribution 4.0 licence. Attribution: The Plumbing Brief.
EPA 2022 Clean Watersheds Needs Survey: needs by state and category (CSV)
How this report was built
Methodology
Source. US EPA, 2022 Clean Watersheds Needs Survey Report to Congress (May 2024), Tables 1, 2, B-1, B-2 and C-1, extracted from the published PDF on 4 October 2026. Values are January 2022 dollars.
Derived figures. Rankings and ratios by The Plumbing Brief.
Retrieval date. 4 October 2026.
Data limitations
- Needs are documented capital projects, not estimates of all deterioration; EPA says the total likely understates true need.
- State figures depend on each state’s documentation effort and are not strictly comparable.
- Tribal wastewater needs are surveyed separately by the Indian Health Service and are excluded.
- 2008 and 2012 totals are not directly comparable to 2022 because categories and methods changed; they are included in the CSV for reference only.
Source quality ranking
Tier 1. US Environmental Protection Agency, Clean Watersheds Needs Survey 2022.
Tier 2. None used. Tier 3. None used.
Summary for reporters
US communities have documented $630.1 billion in clean-water infrastructure needs for 2022 to 2041, according to EPA’s 2022 Clean Watersheds Needs Survey, including $97.4 billion to replace and rehabilitate deteriorating sewer pipes and $74.7 billion for septic and other decentralized systems. California reported the largest total ($65.5 billion); West Virginia had the highest need per resident ($6,182). EPA says the total likely underestimates true need.
Angles this supports
- Why your sewer bill keeps rising: the $630 billion backlog
- America’s old sewer pipes need $97 billion
- West Virginia faces the biggest sewer bill per resident
- The septic system backlog: $75 billion
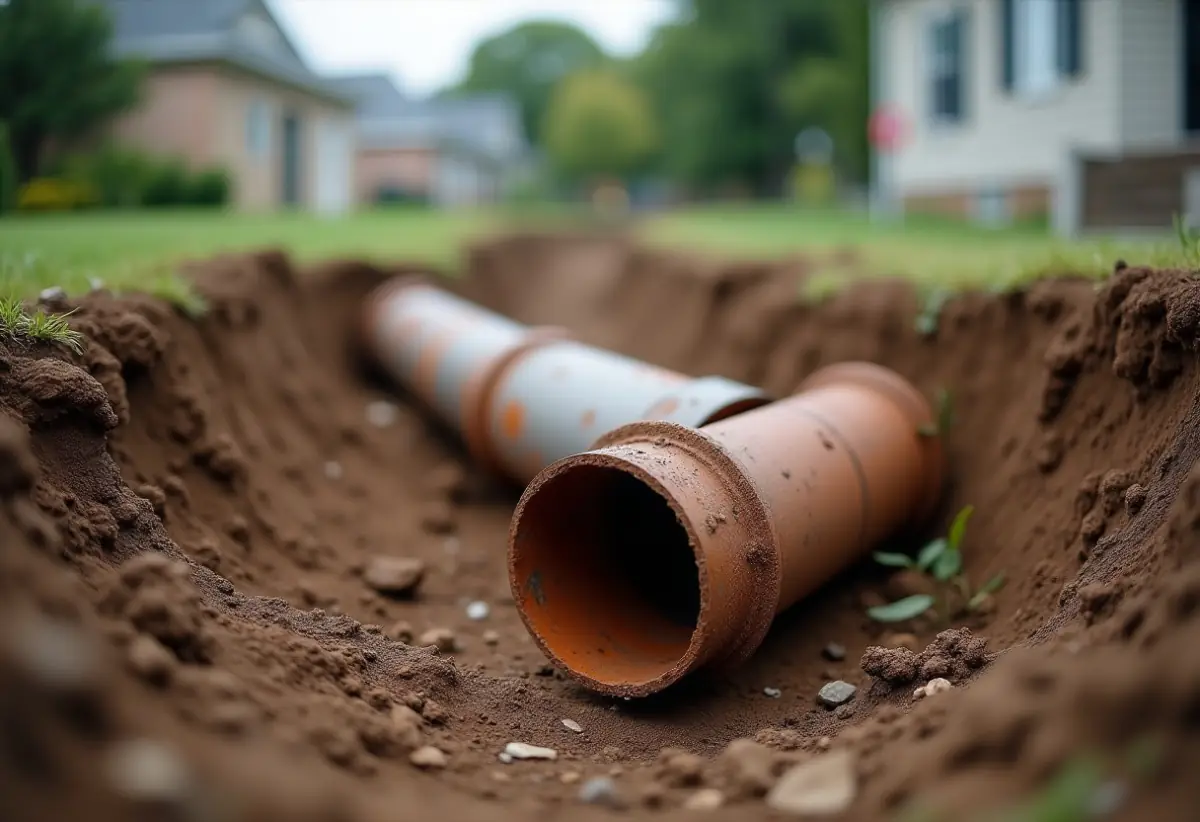
Questions this answers
How much does the US need to spend on sewers? EPA’s 2022 survey documented $630.1 billion in clean-water infrastructure needs over 20 years, including $97.4 billion for sewer pipe replacement and rehabilitation.
Why are sewer bills going up? Utilities are funding treatment upgrades, overflow controls and the replacement of aging sewer pipes, which EPA’s needs survey puts in the hundreds of billions of dollars.
Which state has the largest wastewater needs? California, at $65.5 billion.
How much is needed for septic systems? $74.7 billion for decentralized wastewater treatment, mostly septic.
Is this the full cost? No. EPA says the total likely underestimates true need.
How to cite this report
The Plumbing Brief, “Wastewater Infrastructure Needs by State: EPA’s $630 Billion Sewer and Septic Bill”, https://theplumbingbrief.com/wastewater-infrastructure-needs-by-state/, accessed [date].
Last reviewed: 2026-10-04.