Water Main Break Statistics: Correcting the Most Miscited Number in US Water Infrastructure
The short answer
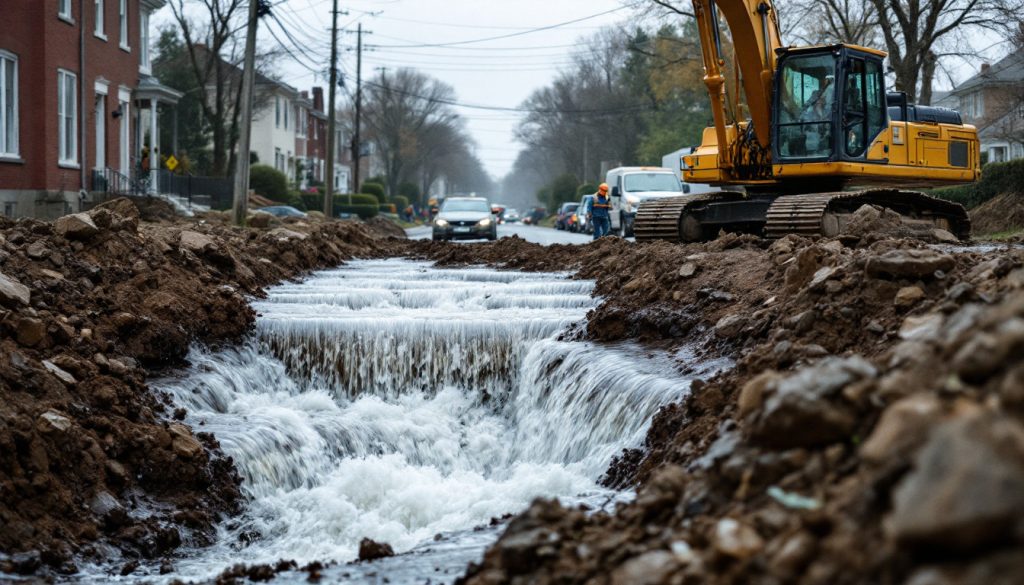
Approximately 260,000 water main breaks occur each year across the United States and Canada combined, per Utah State University research published in 2023. The widely republished figure of 240,000 breaks in the United States alone misstates both the value and the geography.
What this page is. A sourced account of what is actually known about water main breaks in North America, and a correction to the number most commonly quoted. The figure circulating widely is “240,000 water main breaks a year in the United States”. The underlying research reports 260,000 breaks a year across the United States and Canada combined. Both the value and the geography are routinely misstated.
The short version
- The Utah State University study reports approximately 260,000 water main breaks annually across the United States and Canada, not 240,000, and not in the United States alone.
- Those breaks represent approximately 2.6 billion dollars in annual repair costs.
- The break rate fell from 14.0 breaks per 100 miles of pipe per year in the 2018 study to 11.1 in the 2023 study, a decline of about 20 percent.
- Approximately 20 percent of water mains in the US and Canada, about 452,000 miles, are beyond their useful life and have not been replaced because of funding constraints.
- The estimated funding shortfall for that replacement is approximately 452 billion dollars.
- About 33 percent of water mains, roughly 770,000 miles, are more than 50 years old. The average age at failure is 53 years.
- Cast iron and asbestos cement together fell from 41.1 percent of pipe in the 2018 study to 33.3 percent in 2023 as utilities replaced older material.
- Smaller pipes fail far more often. About 86 percent of mains are 12 inches or smaller, and smaller pipes fail roughly five times as often as larger ones.
- Average water loss to leakage across surveyed utilities is approximately 11 percent.
What is wrong with the usual figure
| Claim as commonly published | What the source actually reports |
|---|---|
| 240,000 water main breaks per year | Approximately 260,000 per year |
| In the United States | Across the United States and Canada combined |
| Usually undated | From a study published in 2023, the third in a series after 2012 and 2018 |
| Usually unattributed | Utah Water Research Laboratory, Utah State University, led by Professor Steven L. Barfuss |
Anyone citing a US-only water main break figure should note that no equivalent US-only total is published in this study. The 260,000 figure is a North American total.
What the sources actually say
- Annual water main breaks: approximately 260,000 across the US and Canada. Source: Utah State University, Utah Water Research Laboratory, water main break study, 2023.
- Annual repair cost: approximately 2.6 billion dollars. Source: Utah State University, 2023.
- Break rate, 2023 study: 11.1 breaks per 100 miles per year. Source: Utah State University, 2023.
- Break rate, 2018 study: 14.0 breaks per 100 miles per year, making the change about a 20 percent decline. Source: Utah State University, 2018 and 2023 studies.
- Pipe beyond useful life: approximately 20 percent, or 452,000 miles. Source: Utah State University, 2023.
- Estimated replacement funding shortfall: approximately 452 billion dollars. Source: Utah State University, 2023.
- Mains over 50 years old: approximately 33 percent, or 770,000 miles. Source: Utah State University, 2023.
- Average age at failure: 53 years. Source: Utah State University, 2023.
- Cast iron and asbestos cement share: 33.3 percent in 2023, down from 41.1 percent in 2018. Source: Utah State University, 2018 and 2023 studies.
- Cast iron pipe over 50 years old: approximately 86 percent. Source: Utah State University, 2023.
- Asbestos cement pipe over 50 years old: approximately 41 percent. Source: Utah State University, 2023.
- Pipes 12 inches or smaller: approximately 86 percent of all mains, failing roughly five times as often as larger pipes. Source: Utah State University, 2023.
- Average water loss to leakage: approximately 11 percent. Source: Utah State University, 2023.
- Study scope: more than 800 utilities and about 400,000 miles of pipe, roughly 17 percent of the estimated 2.3 million miles in the US and Canada. Source: Utah State University, 2023.
- Total national drinking water infrastructure need: 625 billion dollars over 20 years. Source: US EPA, 7th Drinking Water Infrastructure Needs Survey and Assessment, 2023.
What is failing, and how old it is
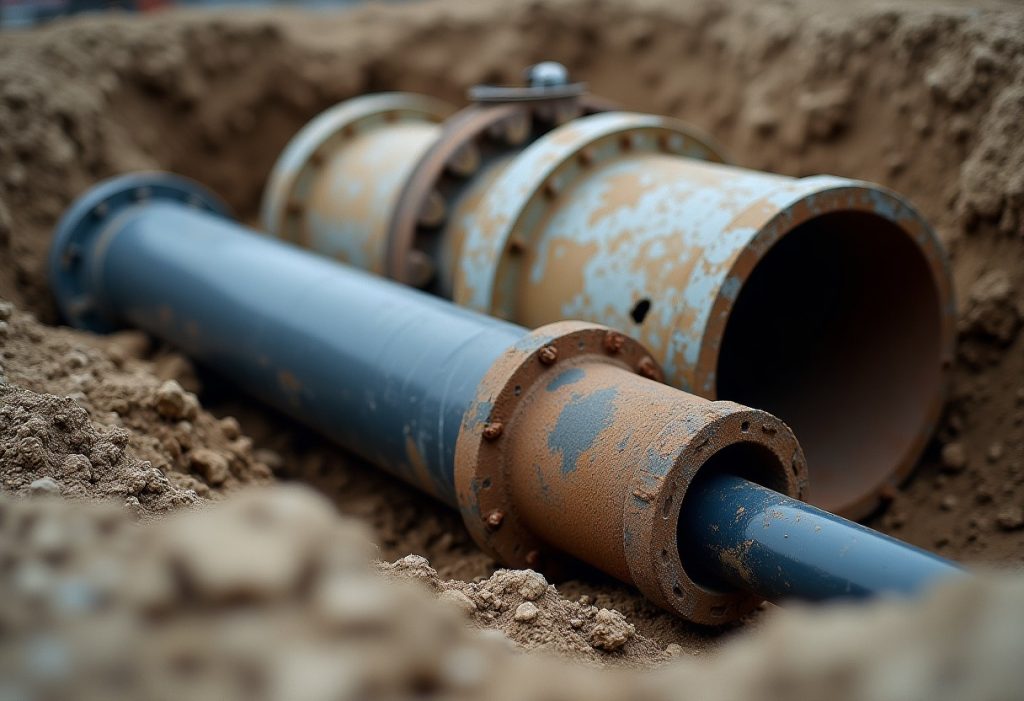
The material mix is changing, and it is changing in the direction that reduces breaks. Cast iron and asbestos cement, the two materials most associated with age-related failure, fell from 41.1 percent of surveyed pipe in 2018 to 33.3 percent in 2023.
| Measure | 2018 study | 2023 study |
|---|---|---|
| Break rate per 100 miles per year | 14.0 | 11.1 |
| Cast iron and asbestos cement share of pipe | 41.1 percent | 33.3 percent |
Source: Utah State University water main break studies, 2018 and 2023.
Among surveyed utilities in the 2023 study, PVC was the most used material at 116,345 miles, followed by ductile iron at 108,670 miles, cast iron at 90,657 miles, asbestos cement at 42,365 miles and steel at 11,358 miles.
Our checks
Derived finding 1: the break rate and the total are consistent, which is how you can check the number
Formula. Break rate per 100 miles multiplied by total miles, divided by 100.
Calculation. 2.3 million miles divided by 100 gives 23,000 hundred-mile units. Multiplied by 11.1 breaks gives approximately 255,300 breaks per year, which rounds to the reported 260,000.
Finding. The reported total and the reported rate are internally consistent when applied to the full North American network. The same arithmetic applied to the 2018 rate of 14.0 gives approximately 322,000 breaks, so the decline in total breaks between studies is roughly 19 percent.
Inputs. Utah State University water main break studies, 2018 and 2023.
Limitations. This arithmetic assumes the surveyed break rate applies to the entire 2.3 million mile network. The survey covered about 17 percent of it, and participating utilities are self-selected.
Derived finding 2: cost per break
Formula. Annual repair cost divided by annual breaks.
Calculation. 2.6 billion dollars divided by 260,000 breaks equals approximately 10,000 dollars per break.
Finding. The average reported repair cost is approximately 10,000 dollars per water main break across the US and Canada.
Inputs. Utah State University, 2023.
Limitations. This is a direct repair cost average. It excludes water lost, traffic disruption, property damage and service interruption, so it understates the total cost of a break.
Derived finding 3: the backlog against the failure age
Formula. Comparison of the share of pipe beyond useful life against the share over 50 years old and the average age at failure.
Finding. Approximately 33 percent of mains are over 50 years old, the average age at failure is 53 years, and approximately 20 percent are already beyond useful life without funded replacement. The share of the network that has passed the typical failure age is therefore larger than the share currently identified as needing replacement.
Inputs. Utah State University, 2023.
Limitations. Age is not the only determinant of failure. Soil chemistry, pressure, installation quality and material all affect service life, and a 50-year-old ductile iron main is not equivalent to a 50-year-old cast iron main.
How this report was built
Methodology
Source selection. Every break statistic on this page comes from the Utah State University water main break study series, which is the research that produced them. Secondary republications were used only to identify the miscitation being corrected, not as a source for any figure.
The correction. This page states the commonly published figure and the source figure side by side rather than silently using the correct one, because readers arriving here will have seen the incorrect version.
Estimates. The three derived findings are calculated by this publication from the figures cited, with formulas stated.
Last updated. 25 September 2026. The USU series has appeared roughly every five years, in 2012, 2018 and 2023.
Data limitations
- The study is a voluntary utility survey covering about 400,000 miles, roughly 17 percent of the estimated 2.3 million miles of main in the US and Canada. Participating utilities are self-selected.
- Figures are for the United States and Canada combined. No US-only break total is published in this series, so any US-only figure attributed to it is an inference rather than a reported number.
- The 2.3 million mile network total is itself an estimate.
- A falling break rate between survey rounds may partly reflect a change in which utilities responded rather than a change in the network.
- Repair cost figures are direct repair costs and exclude water lost, property damage and disruption.
- Age thresholds are summary statistics. Service life varies by material, soil and installation.
Source quality ranking
Tier 1. US EPA, 7th Drinking Water Infrastructure Needs Survey and Assessment, for national infrastructure need.
Tier 2. Utah State University, Utah Water Research Laboratory, water main break studies 2012, 2018 and 2023, led by Professor Steven L. Barfuss. This is the primary research for every break statistic here and is classified Tier 2 only because it is university research rather than a federal statistical programme.
Tier 3. None used as a source for any figure.
Excluded. Secondary republications of the break figure, which are the origin of the 240,000 error and of the US-only geography error.
The corrected figure to use
- The real figure is about 260,000 water main breaks a year, and it covers the United States and Canada, not the US alone.
- Water main breaks cost about 2.6 billion dollars a year to repair, roughly 10,000 dollars each.
- The break rate fell from 14.0 to 11.1 per 100 miles between 2018 and 2023, a decline of about 20 percent.
- About 452,000 miles of water main, one fifth of the network, is past its useful life and unfunded for replacement.
- The average water main fails at 53 years old, and a third of the network is already older than 50.
Correction summary
Water main breaks across the United States and Canada total approximately 260,000 a year, according to research from the Utah Water Research Laboratory at Utah State University, led by Professor Steven L. Barfuss. The figure is frequently republished as 240,000 breaks in the United States alone, which misstates both the value and the geography. The 2023 study, the third in a series after 2012 and 2018, surveyed more than 800 utilities covering about 400,000 miles of pipe, roughly 17 percent of the estimated 2.3 million miles in the two countries. Break rates fell from 14.0 per 100 miles per year in 2018 to 11.1 in 2023, a decline of about 20 percent, as cast iron and asbestos cement fell from 41.1 percent of surveyed pipe to 33.3 percent. Repairs cost approximately 2.6 billion dollars annually. About 452,000 miles of main, one fifth of the network, is beyond useful life without funded replacement.
How to frame it
- The water main break number everyone quotes is wrong in two ways
- North America has 260,000 water main breaks a year, and the rate is falling
- A fifth of North America’s water mains are past their useful life
- The average water main fails at 53 years old
- Water main breaks cost about 10,000 dollars each to repair
Questions about the correction
How many water main breaks happen each year? Approximately 260,000 across the United States and Canada combined, per Utah State University research published in 2023. The widely republished figure of 240,000 is incorrect, and it is not a US-only total.
Is the 240,000 figure wrong? Yes, in two ways. The source reports approximately 260,000, and it covers the United States and Canada rather than the US alone.
What does a water main break cost to repair? Approximately 10,000 dollars on average, derived from 2.6 billion dollars in annual repair costs across about 260,000 breaks. That excludes water lost, property damage and disruption.
Are water main breaks getting more or less frequent? Less frequent by rate. Breaks per 100 miles fell from 14.0 in the 2018 study to 11.1 in 2023, a decline of about 20 percent.
How old are America’s water mains? About 33 percent, roughly 770,000 miles, are more than 50 years old. The average age at failure is 53 years.
How much pipe needs replacing? Approximately 20 percent, about 452,000 miles, is beyond useful life and unfunded, with an estimated shortfall of about 452 billion dollars.
Which pipe materials fail most? Cast iron and asbestos cement are the materials most associated with age-related failure. About 86 percent of cast iron pipe in the survey is over 50 years old.
Does pipe size affect failure? Yes. About 86 percent of mains are 12 inches or smaller, and smaller pipes fail roughly five times as often as larger ones.
How much water is lost to leaks? Approximately 11 percent on average across surveyed utilities.
How reliable is this data? It is a voluntary survey of more than 800 utilities covering about 17 percent of the North American network. Participating utilities are self-selected, and the results are extrapolated rather than measured across the whole system.
Last reviewed: 2026-09-25.
How to cite this report
The Plumbing Brief, “Water Main Break Statistics: Correcting the Most Miscited Number in US Water Infrastructure”, https://theplumbingbrief.com/how-many-water-main-breaks-per-year/, accessed [date].


