How Much Water Is Lost to Leaks? California’s Pipes Lose 92 Billion Gallons a Year
The short answer
California’s urban water systems lost 91.6 billion gallons of treated water to leaks in 2023, 6.0 percent of the water they supplied, according to 511 validated water loss audits filed with the state Department of Water Resources. That is 28.4 gallons per service connection per day, or about 10,400 gallons a year for every connection. The median system lost 24.8 gallons per connection per day.
Where a year of California’s tap water went
| Component, 2023 audits | Acre-feet | Billion gallons | Share of water supplied |
|---|---|---|---|
| Water supplied to distribution systems | 4,703,552 | 1,533 | 100% |
| Billed metered consumption (customers’ bills) | 4,275,027 | 1,393 | 90.9% |
| Real losses: leaks, breaks and tank overflows | 281,127 | 91.6 | 6.0% |
| Apparent losses: meter under-reading, billing errors, theft | 88,892 | 29.0 | 1.9% |
| Unbilled authorized use (firefighting, flushing) | 40,325 | 13.1 | 0.9% |
Source: California Department of Water Resources, urban retail water system annual water loss audit data, audits with a reporting period starting in 2023 that passed or provisionally passed state validation. Calculated by The Plumbing Brief. Rows do not sum exactly to 100 percent because of rounding and a small volume of billed unmetered water. One acre-foot is 325,851 gallons.
Real losses are the leaks. The audit definition covers physical losses from water mains, the utility-owned service connections that run to each customer’s meter, and storage tanks. Leaks on the customer’s side of the meter are not in these figures: that water passes through the meter and is billed. Apparent losses are water that reached a customer but was never paid for, mostly because meters under-record.
Per connection: about as much as a leaky house
Utility-side leakage per connection, compared with household leaks
Formula. Real losses in gallons divided by service connections divided by 365. Compared with EPA’s estimate of leaks inside the average home.
Calculation. 281,127 acre-feet x 325,851 / 8,828,014 connections / 365 = 28.4 gallons per connection per day, or 10,400 gallons a year.
Finding. Each connection to a California urban water system leaks about 10,400 gallons a year before the water reaches the meter. EPA estimates that “the average household’s leaks can account for more than 9,300 gallons of water wasted every year” on the customer’s side (EPA WaterSense). On the averages, pipes in the street lose about as much as the leaks inside a typical home.
Limitations. A connection is not a household: apartment buildings and businesses each count as one connection. EPA’s figure is a national estimate, not a California one.
Eight years of audits: leaks fell, the share did not
| Audit year | Audits | Real losses (acre-feet) | Billion gallons | Share of supply | Gallons per connection per day |
|---|---|---|---|---|---|
| 2016 | 464 | 320,651 | 104.5 | 6.1% | 32.5 |
| 2017 | 493 | 319,454 | 104.1 | 6.0% | 33.4 |
| 2018 | 510 | 282,113 | 91.9 | 5.5% | 30.0 |
| 2019 | 511 | 281,483 | 91.7 | 5.6% | 29.9 |
| 2020 | 520 | 321,286 | 104.7 | 5.6% | 32.6 |
| 2021 | 530 | 274,776 | 89.5 | 5.1% | 27.7 |
| 2022 | 500 | 282,565 | 92.1 | 5.8% | 28.7 |
| 2023 | 511 | 281,127 | 91.6 | 6.0% | 28.4 |
Leakage per connection fell from 32.5 gallons a day in 2016 to 28.4 in 2023, about 12 percent. Over the same years Californians used less water, so supply fell too, and leaks’ share of supply barely moved: 6.1 percent in 2016, 6.0 percent in 2023. Leakage depends mainly on pipe condition and pressure rather than on how much customers use, so conservation alone does little to shrink it. In total the audited systems lost 770 billion gallons to leaks over the eight years.
Most systems leak less than before the standards were set
Formula. Each system’s 2023 leakage compared with its own average for 2017 to 2020, the baseline years in the state regulation. Systems with at least three baseline audits.
Calculation. 459 systems: 275 lower in 2023, 184 higher. Median moved from 29.3 to 25.1 gallons per connection per day. 198 improved by 5 gallons or more; 128 worsened by 5 or more.
Finding. About 60 percent of systems reduced leakage against their own baseline, and the typical system improved by about 4 gallons per connection per day.
Limitations. Year-to-year audit values move with data quality as well as with real leakage; the state allows suppliers to drop a baseline year that differs by more than 10 gallons from the others.
The 2028 deadline
California now sets a leakage limit for each urban utility. Under Title 23, sections 980 to 986, adopted by the State Water Resources Control Board in Resolution 2022-0044 on 19 October 2022, each urban retail supplier “shall reduce real loss from its distribution systems to no greater than the real water loss standard” set for it “no later than January 1, 2028”. Each standard comes from an economic model run on the supplier’s own data. Suppliers whose baseline is 16 gallons per connection per day or less, and whose audits meet data-quality criteria, may apply for a 16-gallon standard. After 2028, compliance is checked every third year on a three-year average, with an allowance of 5 gallons per connection per day above the standard. In the resolution, the Board noted that “multiple suppliers were losing over 100 gallons per connection per day” in 2019.
| System size, 2023 | Audits | Median leakage (gal/conn/day) | Real losses as share of supply | Median infrastructure leakage index |
|---|---|---|---|---|
| Under 10,000 connections | 296 | 28.9 | 7.2% | 1.57 |
| 10,000 to 24,999 | 125 | 22.6 | 6.2% | 1.40 |
| 25,000 to 99,999 | 81 | 19.3 | 4.4% | 1.04 |
| 100,000 and over | 9 | 29.9 | 7.5% | 1.83 |
The infrastructure leakage index divides actual leakage by the leakage considered technically unavoidable for a system of that length, pressure and number of connections; 1.0 means a system is at that floor. Groups with fewer than 20 audits should be read with care. For the pipe failures behind many of these losses, see how many water mains break each year.
What it means for plumbers
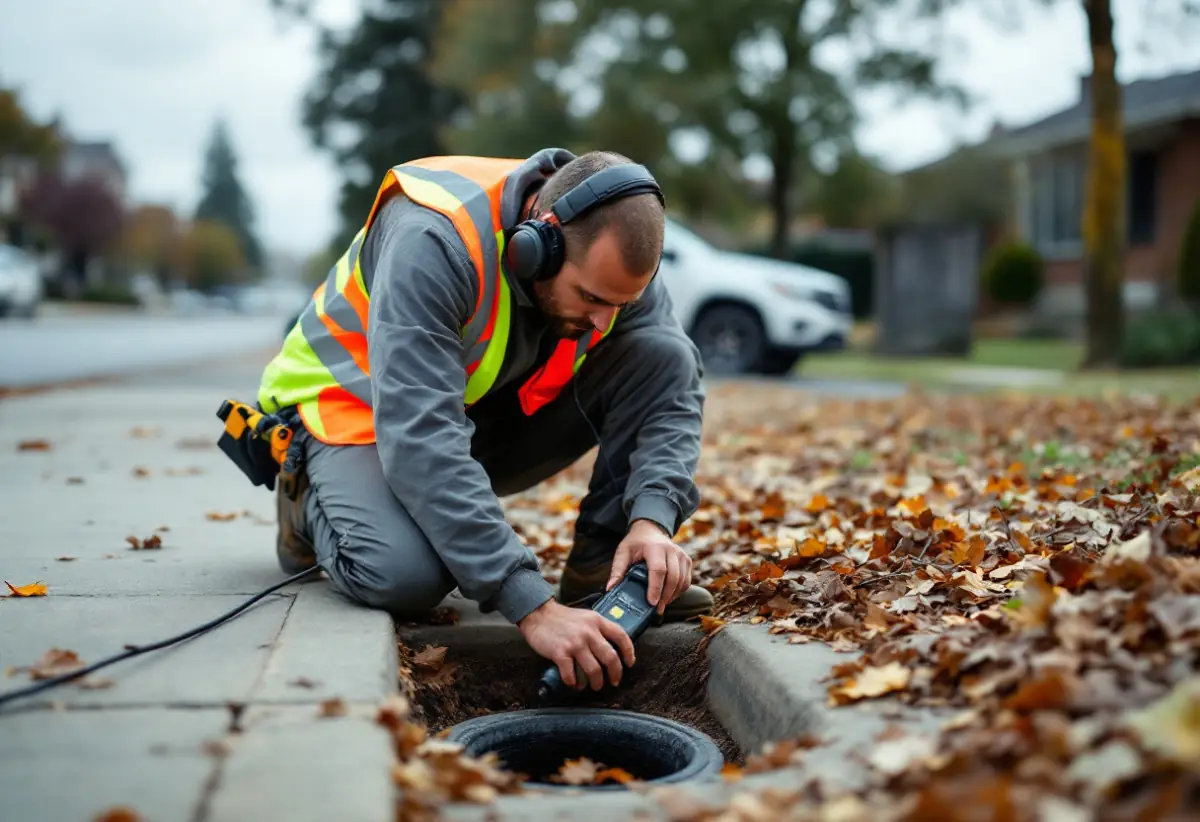
- The 2028 standards are likely to mean more active leak detection by utilities on mains and service connections, the line up to the meter. Work past the meter stays the property owner’s.
- Apparent losses are mostly customer meters under-recording (77 percent of apparent losses in 2023), one reason utilities replace ageing meters.
- Inside the home, EPA’s figure of more than 9,300 gallons a year per household is the comparable number for customer-side leaks. Our household leak rates report covers how often homes report them.
Figures worth quoting
- California’s urban water systems lost 91.6 billion gallons to leaks in 2023, 6.0 percent of supply.
- That is 28.4 gallons per connection per day, about 10,400 gallons a year per connection.
- Leakage per connection fell about 12 percent from 2016 to 2023, but leaks’ share of supply stayed near 6 percent.
- Utilities valued the leaked water at $231 million in 2023, mostly at production cost.
Download the data
Statewide totals by audit year, 2023 breakdowns by system size and connection density, and the 2023 distribution of systems by leakage. Aggregated; no individual systems. Published under a Creative Commons Attribution 4.0 licence. Attribution: The Plumbing Brief.
California water loss audits, 2016 to 2024 summary (CSV)
How this report was built
Methodology
Source. California Department of Water Resources, CA Urban Retail Water System Water Loss Annual Loss Audit Data (file ca-retailer-waterlossdata.csv, public domain, compiled from AWWA Free Water Audit Software submissions), downloaded 29 October 2026. Regulation text from the State Water Resources Control Board; household leak estimate from EPA WaterSense.
Selection. Audits with a reporting period starting 2016 to 2024 and status “Requirements Addressed” or “Preliminarily Approved”. Excluded: 305 audits that did not meet validation requirements, 118 still under review, 9 wholesale systems and 17 audits reporting negative real losses. Years are assigned by the start of the reporting period, as DWR recommends; a fiscal-year audit starting July 2023 counts as 2023. 2024 is shown in the CSV but left out of trends because many audits are still under review.
Calculations. Volumes use DWR’s acre-foot conversions. Leakage per connection is computed the same way for every system (real losses divided by service connections and 365), including low-density systems that report in gallons per mile. Aggregate figures divide total losses by total connections; medians describe the typical system. Infrastructure leakage index values are as reported in the audits.
Retrieval date. 29 October 2026.
Data limitations
- Real losses are estimated in each audit as total losses minus apparent losses, so errors in metering or apparent-loss estimates flow into leakage figures.
- Audit data validity scores (median 67 of 100 in 2023) show moderate confidence in the inputs; validation checks method, not every number.
- Coverage is California urban retail suppliers (more than 3,000 connections or 3,000 acre-feet a year), with one audit per potable water system. Smaller systems are not covered.
- California results are not a national estimate. Some other states also require utility water audits; their data are not combined here.
- Individual systems are not named in this report. Leakage depends on pipe age, pressure, soil, density and data quality.
Source quality ranking
Tier 1. California Department of Water Resources validated water loss audit data; State Water Resources Control Board Resolution 2022-0044 and adopted regulation text; US EPA WaterSense.
Tier 2. None used. Tier 3. None used.
Excluded. Paid market-research estimates of national water loss, which do not publish their inputs.
Briefing note
California’s urban water systems lost 91.6 billion gallons of treated water to leaks in 2023, 6.0 percent of what they supplied, according to an analysis of 511 validated state water loss audits by The Plumbing Brief. That works out to about 10,400 gallons a year per service connection, similar to EPA’s estimate of leaks inside the average home. Leakage per connection has fallen about 12 percent since 2016, but leaks’ share of supply has stayed near 6 percent. Suppliers must meet individual leakage standards by January 2028.
How reporters could frame this
- California’s pipes leak 92 billion gallons a year
- Every water connection loses as much as a leaky house
- Californians saved water; the leaks did not shrink with it
- The 2028 leak limits: what they mean for water bills
Related questions
How much water is lost due to leaky pipes? In California’s audited urban systems, 91.6 billion gallons in 2023, or 6.0 percent of water supplied (CA DWR audits).
How much water do utilities lose per connection? 28.4 gallons per connection per day statewide in 2023; the median system lost 24.8.
How much water do household leaks waste? EPA estimates the average household’s leaks waste more than 9,300 gallons a year, and nearly 1 trillion gallons nationwide.
What is non-revenue water? Water a utility produces but does not bill: real losses (leaks), apparent losses (meter and billing errors, theft) and unbilled authorized use.
What is California’s water loss standard? Each urban retail supplier must cut real losses to an individual standard by 1 January 2028, under Title 23 sections 980 to 986.
Are leaks after the water meter included? No. Leaks on the customer’s side of the meter are recorded as billed consumption, not as utility losses.
How to cite this report
The Plumbing Brief, “How Much Water Is Lost to Leaks? California’s Pipes Lose 92 Billion Gallons a Year”, https://theplumbingbrief.com/how-much-water-is-lost-to-leaks/, accessed [date].
Last reviewed: 2026-10-29.