Household Plumbing Breakdowns: How Often US Homes Lose Water, Toilets and Sewer
The short answer
In a typical three-month period, 3.5 percent of US homes, about 4.6 million, lose running water completely, 1.7 percent have every toilet out of service at once, and 1.2 percent have a sewage system breakdown, according to the 2023 American Housing Survey. Homes with one bathroom lose all toilets at 4.7 times the rate of homes with two and a half or more.
What we measured and found
The American Housing Survey asks every household three plumbing failure questions with a three-month window: was the home completely without running water, were all of its flush toilets out of service at the same time, and did its sewer or septic system break down. The Census Bureau publishes the national counts. This report breaks them down by the kind of home that suffers them, using the public use file and its replicate weights. The same measures across five survey years are compared in our plumbing problems trend report.
| Failure in the previous 3 months | Homes (thousands) | ± (90%) | Rate | Universe |
|---|---|---|---|---|
| Completely without running water | 4,647 | ±237 | 3.5% | Homes with piped water (132,895k) |
| of which lasted 6 hours or more at least once | 3,518 | ±266 | 2.6% | Homes with piped water |
| All flush toilets not working at once | 2,287 | ±162 | 1.7% | Homes with a flush toilet (133,109k) |
| Public sewer breakdown | 1,261 | ±112 | 1.2% | Homes on public sewer (108,231k) |
| Septic tank or cesspool breakdown | 396 | ±70 | 1.6% | Homes on septic (24,616k) |
Source: Census Bureau, AHS 2023 Table Creator estimates (Housing Quality table) for the counts; rates and the 6-hour row calculated by The Plumbing Brief from the PUF. The 6-hour margin is approximate, converted from percentage points.
Measured values, sourced
- Homes completely without running water at some point in the previous 3 months: 4,647,000 (±237,000). Source: AHS 2023.
- Of those, homes where at least one stoppage lasted 6 hours or more: 3,518,000. Source: calculated from the AHS 2023 PUF.
- Homes with 4 or more stoppages of 6 hours or more in 3 months: 502,000 (±82,000). Source: AHS 2023.
- Homes where every flush toilet was out of service at the same time: 2,287,000 (±162,000). Source: AHS 2023.
- Homes where that happened 4 or more times for 6 hours or longer: 329,000 (±60,000). Source: AHS 2023.
- Homes on public sewer with a breakdown in 3 months: 1,261,000 (±112,000) of 108,231,000. Source: AHS 2023.
- Homes on septic with a breakdown in 3 months: 396,000 (±70,000) of 24,616,000. Source: AHS 2023.
- Water stoppage rate, buildings of 50 or more units: 7.7 percent (±1.0). Single-family detached: 2.3 percent (±0.2). Source: calculated from the AHS 2023 PUF.
- Water stoppage rate, homes on an individual well: 4.7 percent (±0.7). Public or private system: 3.4 percent (±0.2). Source: calculated from the AHS 2023 PUF.
- Toilet outage rate, one-bathroom homes: 3.3 percent (±0.3). Homes with 2.5 or more bathrooms: 0.7 percent (±0.2). Source: calculated from the AHS 2023 PUF.
- Toilet outage rate, renters: 3.0 percent. Owners: 1.0 percent. Source: calculated from the AHS 2023 PUF.
- Among a half-sample of homes that had a power outage, pipes froze during the outage in 1.9 percent (673,000 homes, ±139,000). Source: AHS 2023.
Water outages by building type
| Group | Lost all running water | ± | All toilets out | ± |
|---|---|---|---|---|
| Single-family detached | 2.3% | 0.2 | 1.2% | 0.1 |
| Single-family attached | 2.5% | 0.5 | 1.4% | 0.4 |
| 2 to 4 units | 4.4% | 0.8 | 3.5% | 0.7 |
| 5 to 49 units | 6.2% | 0.6 | 2.9% | 0.4 |
| 50 or more units | 7.7% | 1.0 | 2.6% | 0.6 |
| Mobile home | 7.6% | 1.3 | 2.5% | 0.8 |
| Owners | 2.7% | 0.2 | 1.0% | 0.1 |
| Renters | 5.1% | 0.3 | 3.0% | 0.3 |
| Before 1940 | 3.7% | 0.6 | 2.3% | 0.4 |
| 1940 to 1959 | 3.4% | 0.5 | 2.1% | 0.3 |
| 1960 to 1979 | 3.9% | 0.3 | 2.0% | 0.3 |
| 1980 to 1999 | 3.8% | 0.4 | 1.7% | 0.2 |
| 2000 to 2009 | 2.9% | 0.4 | 0.9% | 0.2 |
| 2010 or later | 2.5% | 0.4 | 1.0% | 0.3 |
Source: calculated by The Plumbing Brief from the AHS 2023 PUF. Margins are 90 percent, in percentage points.
Toilet outages by number of bathrooms
Derived measures
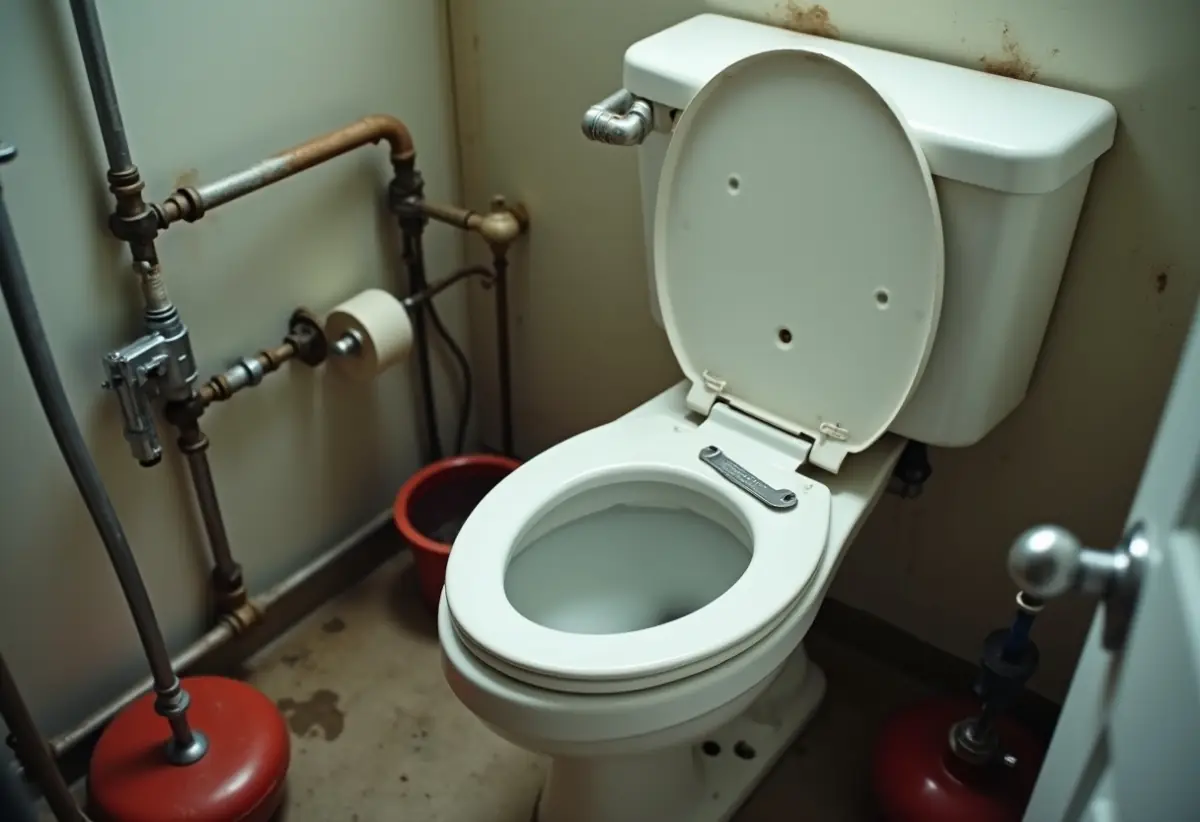
A single bathroom multiplies outage risk by 4.7
Formula. Rate of all-toilets-out in one-bathroom homes divided by the rate in homes with 2.5 or more bathrooms.
Calculation. 3.3 / 0.7 = 4.7. One-bathroom homes number 40,283,000, and 1,332,000 of them lost every toilet at some point in three months.
Finding. One-bathroom homes are 30 percent of the stock but account for 58 percent of all-toilets-out cases. With a single toilet, any clog, broken flapper or supply failure is a total outage.
Limitations. One-bathroom homes are older, smaller and more often rented, all of which are associated with higher failure rates. The ratio is not adjusted for those factors.
Large apartment buildings lose water at 3.3 times the house rate
Formula. Water stoppage rate in buildings of 50 or more units divided by the rate in detached single-family houses.
Calculation. 7.7 / 2.3 = 3.3.
Finding. Shared plumbing systems concentrate outages: a riser repair or booster pump failure takes every unit off water at once, and building-wide shutoffs for planned work count as stoppages. Mobile homes, at a similar rate, have a different exposure, with small-bore exposed supply lines.
Limitations. The survey does not ask whether a stoppage was planned maintenance, a utility main break or a failure in the building. All three are counted.
Septic and sewer break down at similar rates
Formula. Breakdown rates for homes on public sewer and on septic tanks or cesspools.
Calculation. Public sewer 1.2 percent (±0.1); septic 1.6 percent (±0.3).
Finding. The difference is within the margins. Neither system is measurably more reliable in a given quarter on this evidence. The counts differ because far more homes are on sewer.
Limitations. A breakdown is only recorded if the system was completely unusable. Slow drains and partial backups are not counted.
Headline measurements
- 4.6 million US homes lose running water completely in a typical three months.
- 2.3 million homes have every toilet out of service at the same time in a typical three months.
- One-bathroom homes lose all toilets at 3.3 percent, homes with 2.5 or more bathrooms at 0.7 percent.
- Buildings of 50 or more units lose water at 7.7 percent, detached houses at 2.3 percent.
- Homes on private wells lose water at 4.7 percent, homes on public systems at 3.4 percent.
Download the data
Every rate in this report with its 90 percent margin, estimate and base. Published under a Creative Commons Attribution 4.0 licence. Attribution: The Plumbing Brief.
Water, toilet and sewer outages by home type (AHS 2023) (CSV)
How this report was built
Methodology
Source. 2023 American Housing Survey National Public Use File, version 1.1, downloaded from the Census Bureau on 4 October 2026. The AHS is sponsored by HUD and conducted by the Census Bureau; the 2023 national sample covers about 133.2 million occupied homes once weighted. Anyone curious how we got indoor plumbing in the first place might enjoy the history of indoor plumbing.
Universe. Occupied housing units. Water stoppages: homes with hot and cold piped water (HOTWATER not 7). Toilet outages: homes with at least one flush toilet. Sewage breakdowns: homes on public sewer (including septic shared by 6 or more units) or on a septic tank or cesspool. All three questions cover the 3 months before interview.
Items used. NOWAT and NOWATFREQ (water supply stoppage and count of 6-hour stoppages), NOTOIL (all flush toilets not working), BATHROOMS, SEWTYPE, SEWUSERS, SEWBREAK, WATSOURCE, OUTPIPEFZ (pipes froze during a power outage, asked of a half sample), with BLD, TENURE, YRBUILT and DIVISION as breakdowns.
Estimation. Every estimate is a weighted total using the PUF final weight (WEIGHT). Before any cross-tabulation was run, the national totals were reproduced against the Census Bureau’s own published Table Creator figures; every national figure quoted in this report matches the published estimate exactly.
Margins of error. Calculated from the 160 replicate weights supplied on the PUF (REPWEIGHT1 to REPWEIGHT160) by successive difference replication, variance = 4/160 × Σ(replicate − full)², at the 90 percent confidence level (1.645 standard errors). The method reproduces the Census Bureau’s published margins exactly for the national rows checked (for example 11,215,000 homes with an inside leak, ±346,000). Percentages carry margins in percentage points.
Derived figures. All cross-tabulations by year built, building type, tenure, division and metro status, all rates and all ratios are calculated by The Plumbing Brief from the PUF. They are not published Census tables.
Retrieval date. 4 October 2026.
Data limitations
- Everything here is self-reported by the household. A leak the occupants did not notice, or forgot, is not counted, so true incidence is likely higher than measured.
- The AHS 2023 is a single cross-section. It shows how rates differ between kinds of homes, not how any home changes as it ages.
- Year built, building type and tenure overlap heavily: older homes are more often rented and more often in multi-unit buildings. The breakdowns here are one variable at a time and do not separate those effects.
- Census divisions are the finest national geography the PUF supports. State and metro rates cannot be produced reliably from this file.
- Small groups carry wide margins. Where two margins overlap, the difference between the groups should not be treated as established.
- The three-month window is a snapshot. Annual rates cannot be obtained by multiplying by four, because the same homes tend to have repeat failures.
- A water stoppage includes utility main breaks, planned building shutoffs and unpaid-bill disconnections. The survey does not separate causes.
Source quality ranking
Tier 1. US Census Bureau and US Department of Housing and Urban Development, American Housing Survey 2023, National Public Use File v1.1, household file; AHS 2023 Table Specifications and PUF Estimates for User Verification; AHS 2023 Definitions (Appendix A); AHS 2023 Value Labels Package.
Tier 2. None used. Tier 3. None used.
Excluded. Insurance-industry claim frequencies and leak-sensor vendor statistics. Both describe customers of a product, not a representative sample of US homes, and neither publishes a sampling method.
Briefing note
In a typical three-month period about 4.6 million US homes are left completely without running water at least once, 2.3 million have every toilet out of service at the same time, and 1.66 million have a sewer or septic breakdown, according to the 2023 American Housing Survey. An analysis of the survey’s public use file by The Plumbing Brief found that households with a single bathroom lose all toilet service at 3.3 percent against 0.7 percent for homes with two and a half or more bathrooms, and that residents of buildings with 50 or more units lose running water at 7.7 percent against 2.3 percent for detached houses. Homes on private wells lose water at 4.7 percent against 3.4 percent for homes on public systems.
Story angles
- Every quarter, 4.6 million American homes run dry
- Why the second bathroom is the best plumbing insurance
- Big apartment buildings lose water three times as often as houses
- Well owners lose water more often than city customers
- Sewer or septic: neither is more reliable
Questions about the measurements
How often do US homes lose running water? 3.5 percent of homes with piped water, about 4.6 million, were completely without running water at least once in the previous three months (AHS 2023).
How common is it for every toilet in a home to stop working? 1.7 percent of homes with a flush toilet, about 2.3 million, had all toilets out of service at once in the previous three months.
Does having more bathrooms reduce the risk? Yes. One-bathroom homes lost all toilets at 3.3 percent, homes with 2.5 or more bathrooms at 0.7 percent.
Do apartments lose water more often than houses? Yes. Buildings of 50 or more units: 7.7 percent. Detached houses: 2.3 percent.
Do private wells fail more often than public water? Homes on an individual well lost water at 4.7 percent (±0.7), public systems at 3.4 percent (±0.2).
Does septic break down more often than sewer? Not measurably. Septic 1.6 percent, public sewer 1.2 percent; the margins overlap.
What counts as a water stoppage? The home was completely without running water from its regular source, for any reason, including storms, broken pipes, utility shutdowns and unpaid bills.
How often do pipes freeze during a power cut? Among homes that had a power outage, pipes froze in 1.9 percent, about 673,000 homes, in the AHS 2023 half-sample that was asked.
How to cite this report
The Plumbing Brief, “Household Plumbing Breakdowns: How Often US Homes Lose Water, Toilets and Sewer”, https://theplumbingbrief.com/household-plumbing-breakdowns/, accessed [date].
Last reviewed: 2026-10-04.