How Long Water Problems Take to Fix: 902,000 Closed Complaints by Category and Agency
The short answer
Across 902,000 closed New York City water and plumbing complaints in 2024 and 2025, heat and hot water cases closed in a mean 1.3 days and plumbing cases in 20.8. Which agency owns the complaint predicts closure time far better than the problem does: 4.3 days at the water utility against 131.6 at Parks.
What the closure record shows
New York City records a creation and closure timestamp on every 311 service request. For water, plumbing and sewer categories, 902,000 cases were created and closed in 2024 and 2025, which makes it possible to measure how long each kind of problem actually takes to resolve rather than how long a service standard says it should. Our companion report on New York’s water and plumbing complaints counts the full complaint record by category.
The spread is enormous, and it does not track severity. It tracks which city agency the complaint routes to.
Mean days to close, by category
| Complaint category | Closed cases 2024 to 2025 | Mean days to close |
|---|---|---|
| HEAT/HOT WATER | 576,197 | 1.3 |
| Water System | 141,241 | 4.2 |
| PLUMBING | 135,073 | 20.8 |
| WATER LEAK | 83,423 | 25.0 |
| General Construction/Plumbing | 72,120 | 46.6 |
| Sewer | 50,339 | 3.8 |
| Root/Sewer/Sidewalk Condition | 17,451 | 131.6 |
| Water Conservation | 7,822 | 1.6 |
| Water Quality | 2,601 | 14.3 |
| Sewer Maintenance | 80 | 137.2 |
| Water Maintenance | 64 | 299.1 |
Source: NYC 311 Service Requests, cases created and closed between 1 January 2024 and 31 December 2025. Means calculated by the Socrata API across closed cases only.
Mean days to close, by agency
| Agency | Closed cases | Mean days to close |
|---|---|---|
| Department of Housing Preservation and Development | 794,693 | 7.1 |
| Department of Environmental Protection | 202,147 | 4.3 |
| Department of Buildings | 72,120 | 46.6 |
| Department of Parks and Recreation | 17,451 | 131.6 |
Source: NYC 311 Service Requests, 2024 to 2025 closed cases in water, plumbing and sewer categories.
The evidence
- Fastest category: heat or hot water, 1.3 days across 576,197 closed cases. Source: NYC 311, 2024 to 2025.
- Second fastest: sewer, 3.8 days across 50,339 cases. Source: NYC 311.
- Third: water system, 4.2 days across 141,241 cases. Source: NYC 311.
- Plumbing: 20.8 days across 135,073 cases. Source: NYC 311.
- Water leak: 25.0 days across 83,423 cases. Source: NYC 311.
- General construction or plumbing: 46.6 days across 72,120 cases. Source: NYC 311.
- Slowest meaningful category: roots, sewer or sidewalk condition, 131.6 days across 17,451 cases. Source: NYC 311.
- Department of Environmental Protection, the water utility: 4.3 days across 202,147 cases. Source: NYC 311.
- Department of Housing Preservation and Development: 7.1 days across 794,693 cases, the largest caseload. Source: NYC 311.
- Department of Buildings: 46.6 days across 72,120 cases. Source: NYC 311.
- Department of Parks and Recreation: 131.6 days across 17,451 cases. Source: NYC 311.
- Ratio between slowest and fastest agency: 30.6 times. Source: calculated from NYC 311.
- Two very small categories, water maintenance at 299.1 days across 64 cases and sewer maintenance at 137.2 across 80, are reported but too small to generalise from. Source: NYC 311.
What the numbers imply
The agency predicts closure time better than the problem does
Formula. Ratio between the slowest and fastest agency mean, compared against the ratio between the slowest and fastest high-volume category.
Calculation. Agencies: 131.6 divided by 4.3 equals 30.6. High-volume categories excluding the two tiny ones: 131.6 divided by 1.3 equals 101, but the slowest category and the slowest agency are the same cases, so the comparison collapses.
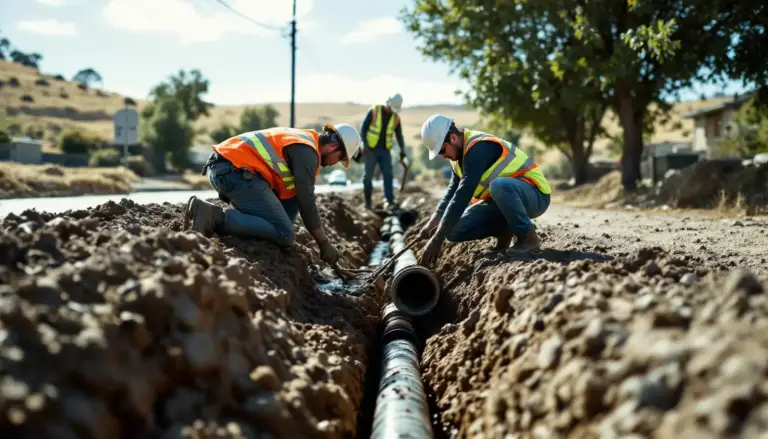
Finding. The four agencies handling water complaints differ by a factor of 30.6 in mean closure time. Because categories map almost one to one onto agencies, the category differences in the first table are substantially agency differences. A tree root in a sewer line is not inherently 100 times harder than no hot water; it routes to a different department with different workload and different remedies. Our guide to tree roots in a sewer line covers what clearing one actually involves.
Limitations. Agency and category are collinear here, so this analysis cannot separate the effect of the organisation from the effect of the work. A root intrusion genuinely does take longer than restoring hot water. The claim is that organisation explains more of the spread than severity does, not that severity is irrelevant.
The largest category is also the fastest
Formula. Compare case volume against mean closure time across categories.
Calculation. Heat or hot water is 576,197 of 902,000 closed cases, 63.9 percent, at 1.3 days. Roots, sewer or sidewalk is 1.9 percent of cases at 131.6 days.
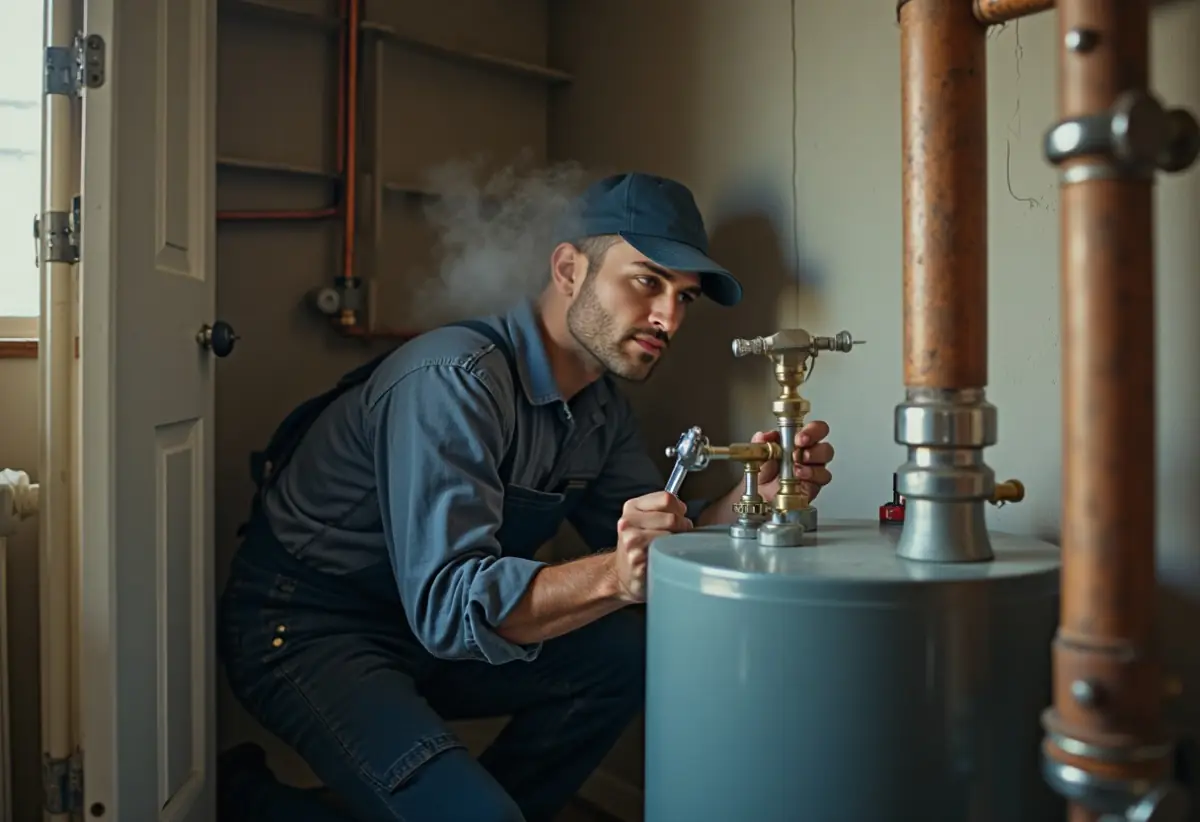
Finding. Volume and speed move together rather than against each other. The category with the most cases closes fastest, which is consistent with a standardised high-throughput enforcement pathway rather than case-by-case investigation. Heat and hot water is that category, and the building boilers behind it are the subject of our report on NYC boiler inspections.
Limitations. A fast closure is not necessarily a resolved problem. A case can be closed because an inspector could not gain access, because the condition was not observed, or because the complaint was redirected. The dataset records closure, not outcome.
Closure speed says nothing about whether the problem was fixed
Formula. None. This is a statement about what the field measures.
Finding. The closed date records when a case was administratively closed. It does not record whether the underlying plumbing problem was repaired, and the dataset contains no outcome field that would allow that to be measured.
Limitations. Any reading of these figures as repair performance is unsupported. They measure case handling, which is the only thing the data contains.
Download the data
Category closure times published as a CSV under a Creative Commons Attribution 4.0 licence. Attribution: The Plumbing Brief.
Mean days to close by complaint category (CSV)
How this report was built
Methodology
Source. NYC 311 Service Requests on NYC Open Data, queried through the Socrata API on 2 October 2026.
Scope. Cases in eleven water, plumbing and sewer complaint categories, created between 1 January 2024 and 31 December 2025, where a closed date is present. Open cases are excluded, which is stated because it biases the figures: a category with many long-running open cases will look faster than it is.
Statistic used. Mean days between creation and closure, computed by the Socrata API. This is a mean, not a median. Means are pulled upward by long-running outliers, so every figure here should be read as higher than the typical case.
Category consolidation. Category labels in this dataset exist in multiple casings. The categories queried here use the dominant casing for each.
Derived figures. Agency ratios and volume shares are calculated by this publication.
Retrieval date. 2 October 2026.
Data limitations
- These are means, not medians. Long-running outliers inflate every figure. A median would be lower in every category.
- Open cases are excluded. Categories with a backlog of unresolved cases appear faster than they are.
- Closure is not resolution. A case can close without the problem being fixed, and no outcome field exists.
- Agency and category are collinear, so their effects cannot be separated in this analysis.
- Two categories have fewer than 100 cases and are reported for completeness only.
- New York City only. No comparable multi-city dataset exists.
- Service standards differ by agency and by complaint type, so a slower mean does not necessarily indicate a missed target.
Source quality ranking
Tier 1. NYC 311 Service Requests, a municipal administrative dataset published through NYC Open Data.
Tier 2. None used. Tier 3. None used.
Excluded. Any closure-time figure that does not state whether open cases were included or whether the statistic is a mean or a median.
Figures worth quoting
- Heat and hot water complaints close in a mean 1.3 days. Tree-root sewer cases take 131.6.
- The four agencies handling water complaints differ by a factor of 30.6 in closure time.
- The water utility closes cases in 4.3 days. Parks takes 131.6.
- The largest complaint category is also the fastest to close.
- A closed case is not a fixed pipe. The dataset records closure, not outcome.
Briefing note
Across 902,000 New York City water, plumbing and sewer complaints created and closed in 2024 and 2025, mean closure time ranged from 1.3 days for heat and hot water to 131.6 days for tree root and sewer condition cases, according to the city’s 311 dataset. Plumbing complaints averaged 20.8 days and water leaks 25.0. The strongest predictor of closure time is not the problem but the agency: the Department of Environmental Protection closed 202,147 cases in a mean 4.3 days while the Department of Parks and Recreation took 131.6 days across 17,451, a factor of 30.6. The largest category, heat and hot water at 63.9 percent of all cases, is also the fastest. All figures are means rather than medians and exclude open cases, so each should be read as an upper bound on the typical case and as a measure of case handling rather than of repair.
How reporters could frame this
- Which agency gets your complaint matters 30 times more than what the complaint is
- Heat and hot water complaints close in a day. Tree roots take four months
- New York’s water utility is its fastest complaint handler
- The biggest complaint category is also the quickest to close
- A closed 311 case does not mean a fixed pipe
Related questions
How long does a water complaint take to resolve in New York? It depends on the category. Mean closure runs from 1.3 days for heat and hot water to 131.6 days for root and sewer condition cases, across 902,000 closed cases in 2024 and 2025.
What closes fastest? Heat or hot water at 1.3 days, then sewer at 3.8 and water system at 4.2.
What takes longest? Roots, sewer or sidewalk condition at 131.6 days, then general construction or plumbing at 46.6.
How long do plumbing complaints take? A mean 20.8 days across 135,073 closed cases.
How long do water leak complaints take? A mean 25.0 days across 83,423 closed cases.
Which agency is fastest? The Department of Environmental Protection, the water utility, at a mean 4.3 days across 202,147 cases.
Which is slowest? The Department of Parks and Recreation at 131.6 days, which handles tree root intrusion into sewer lines.
Are these medians? No, they are means, which long-running cases pull upward. A median would be lower in every category, and the dataset does not expose one through this query.
Does a closed case mean the problem was fixed? No. Closure is administrative. A case can close because access was refused or the condition was not observed, and no outcome field exists.
Why are plumbing complaints so much slower than water system ones? They route to different agencies. Plumbing and construction cases go to the Department of Buildings at a mean 46.6 days; water system and sewer cases go to the water utility at 4.3 and 3.8.
How to cite this report
The Plumbing Brief, “How Long Water Problems Take to Fix: 902,000 Closed Complaints by Category and Agency”, https://theplumbingbrief.com/water-complaint-resolution-times/, accessed [date].
Last reviewed: 2026-10-02.