Household Plumbing Problems, 2015 to 2023: Are Leaks and Water Outages Getting More Common?
The short answer
Plumbing leaks inside US homes were as common in 2023 as in 2015: 8.4 percent of homes against 8.5 percent, according to five editions of the American Housing Survey. Complete losses of running water did rise, from a low of 2.7 percent of homes in a three-month period in 2019 to 3.5 percent in 2023, while leaks from outside fell from 9.9 to 8.8 percent.
What we measured and found
The American Housing Survey has asked the same plumbing questions in every national survey since its 2015 redesign: did water leak into the home in the past year and why, was the home ever completely without running water, did every toilet stop working, did the sewer or septic system break down. Five surveys, 2015 to 2023, now make it possible to say whether American plumbing is getting more or less reliable. Our companion report on plumbing problems by metro breaks the latest survey down for the largest metro areas.
| Measure, share of homes | 2015 | 2017 | 2019 | 2021 | 2023 |
|---|---|---|---|---|---|
| Water leaked in from an inside source (12 months) | 8.5% | 8.2% | 7.6% | 8.2% | 8.4% |
| Pipes leaked (12 months) | 3.8% | 3.4% | 3.2% | 3.5% | 3.6% |
| Fixtures backed up or overflowed (12 months) | 2.0% | 1.9% | 1.8% | 2.0% | 2.0% |
| Broken water heater leaked (12 months) | 0.9% | 0.8% | 0.7% | 0.8% | 0.8% |
| Water leaked in from outside (12 months) | 9.9% | 10.1% | 9.4% | 8.9% | 8.8% |
| Completely without running water (3 months) | 3.2% | 3.0% | 2.7% | 3.5% | 3.5% |
| All flush toilets out (3 months) | 2.1% | 1.9% | 1.7% | 2.0% | 1.7% |
| Sewer or septic breakdown (3 months) | 1.5% | 1.4% | 1.2% | 1.5% | 1.2% |
Source: calculated by The Plumbing Brief from the AHS National Public Use Files for 2015, 2017, 2019, 2021 and 2023. Margins of error (90 percent) are 0.1 to 0.3 percentage points and are in the CSV.
Measured values, sourced
- Homes with an inside leak: 10,015,000 (2015) and 11,215,000 (2023); as a share 8.47 and 8.42 percent (±0.26). Source: AHS.
- Pipe leaks: 3.84 percent (2015), 3.21 (2019), 3.65 (2023). Source: AHS.
- Complete water stoppage in 3 months: 3.22 percent (2015), 2.72 (2019), 3.50 (2023); 4,647,000 homes in 2023. Source: AHS.
- Outside leaks: 9.95 percent (2015) to 8.82 (2023). Source: AHS.
- All toilets out: 2.07 to 1.72 percent; sewer or septic breakdown: 1.49 to 1.23 percent. Source: AHS.
- Renter inside-leak rate 2023: 10.5 percent; owners 7.3. 2015: 10.7 and 7.2. Source: AHS.
Derived measures
Water outages are up 29 percent since 2019
Formula. Change in the share of homes with a complete water stoppage, 2019 to 2023, with margins.
Calculation. 2.72 percent (±0.13) to 3.50 percent (±0.18), a rise of 0.78 points or 29 percent.
Finding. More households are losing their whole water supply, even though leaks inside the home are no more common. That points away from household plumbing and toward supply-side causes: utility main breaks, building-wide shutoffs and disconnections, all of which the survey counts as stoppages.
Limitations. The survey does not record the cause of a stoppage, so the supply-side explanation is an inference.
Outside leaks fell; inside leaks did not
Formula. Change 2015 to 2023 in inside and outside leak rates.
Calculation. Outside 9.95 to 8.82 percent; inside 8.47 to 8.42 percent.
Finding. As the housing stock adds newer homes, roof and basement leaks have become less common, but plumbing leaks have held steady. Pipes, fixtures and water heaters fail at a stubbornly constant rate.
Limitations. 2021 was collected during the pandemic with more phone interviews, which can shift self-reported answers.
Headline measurements
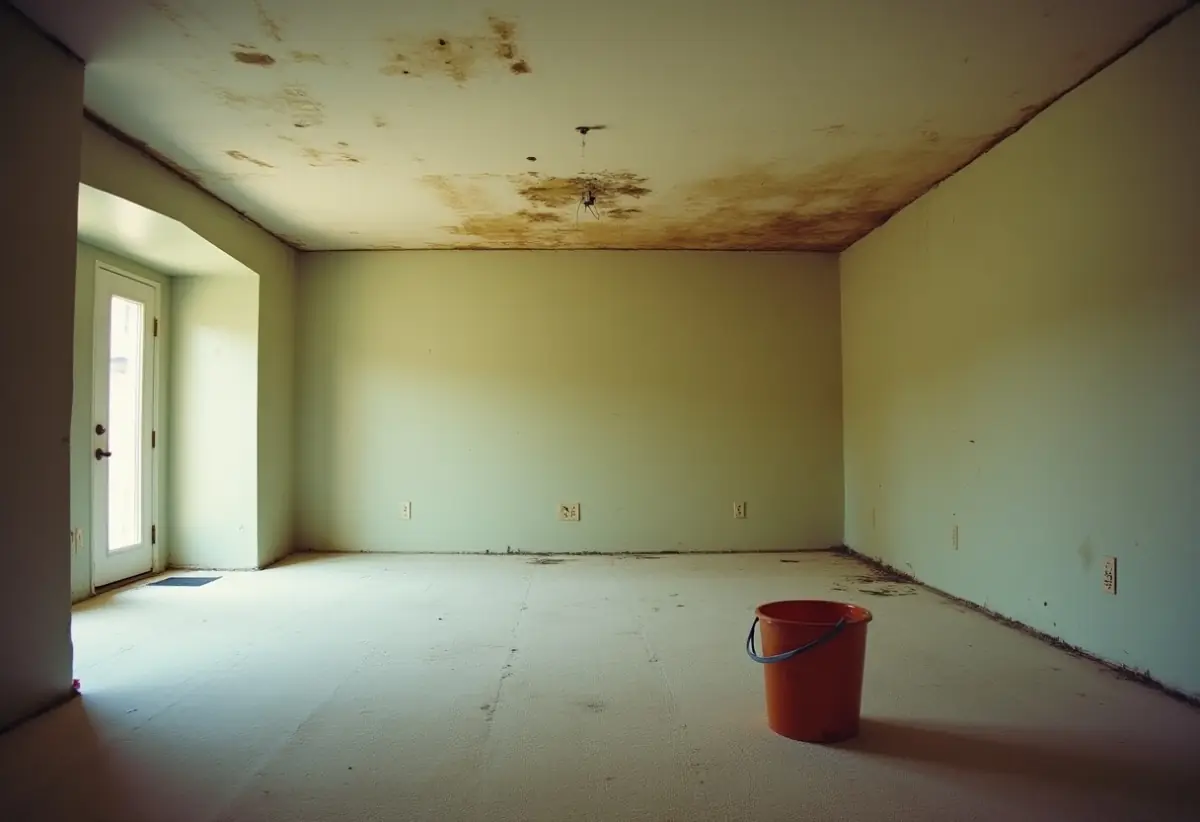
- Inside leaks: 8.5 percent of homes (2015), 8.4 percent (2023).
- Complete water outages: 2.7 percent (2019) to 3.5 percent (2023).
- Outside leaks: down from 9.9 to 8.8 percent.
Download the data
Eight measures, five survey years, with 90 percent margins of error. Published under a Creative Commons Attribution 4.0 licence. Attribution: The Plumbing Brief.
Household plumbing problem rates 2015 to 2023 (AHS), all homes, owners and renters (CSV)
How this report was built
Methodology
Sources. US Census Bureau and HUD, American Housing Survey National Public Use Files: 2015 v3.1, 2017 v3.1, 2019 v1.1, 2021 v1.0 and 2023 v1.1, household files, downloaded from www2.census.gov on 4 October 2026.
Estimation. Identical definitions each year (LEAKI, LEAKIPIPE, LEAKIPLUM, LEAKIWATH, LEAKO, NOWAT, NOTOIL, SEWBREAK) on occupied units, weighted with WEIGHT; 90 percent margins from the 160 replicate weights by successive difference replication. 2023 figures match the Census Bureau’s published estimates.
Retrieval date. 4 October 2026.
Data limitations
- Self-reported; households may not notice or recall every event.
- The survey samples different homes each cycle within a longitudinal panel that is refreshed; changes of a few tenths of a point are within or near sampling error.
- 2021 data collection was affected by the pandemic.
- The causes of water stoppages are not recorded.
Source quality ranking
Tier 1. US Census Bureau and HUD, American Housing Survey, 2015 to 2023.
Tier 2. None used. Tier 3. None used.
Briefing note
The share of US homes with water leaking from an inside source over a year was 8.4 percent in 2023, essentially unchanged from 8.5 percent in 2015, according to an analysis of five American Housing Surveys by The Plumbing Brief. Complete losses of running water rose from 2.7 percent of homes in a three-month period in 2019 to 3.5 percent in 2023, about 4,647,000 homes, while leaks from outside the home fell.
Story angles
- More American homes are losing running water
- Plumbing leaks haven’t improved in a decade
- The water outage rise is a supply problem, not a pipe problem
- Eight years of household plumbing failures, measured
Questions about the measurements
Are plumbing leaks becoming more common? No. 8.4 percent of homes had an inside leak in 2023, against 8.5 percent in 2015 (AHS).
Are water outages increasing? Yes since 2019: 2.7 percent of homes lost all running water in a three-month period in 2019, 3.5 percent in 2023.
Are pipe leaks increasing? Not clearly: 3.84 percent in 2015, 3.65 percent in 2023.
Do renters have more plumbing problems? Yes. In 2023, 10.5 percent of renter homes had an inside leak against 7.3 percent of owner homes.
How to cite this report
The Plumbing Brief, “Household Plumbing Problems, 2015 to 2023: Are Leaks and Water Outages Getting More Common?”, https://theplumbingbrief.com/household-plumbing-problems-trend/, accessed [date].
Last reviewed: 2026-10-04.